South Africa National Cricket Team Vs Australian Men’s Cricket Team Match Scorecard

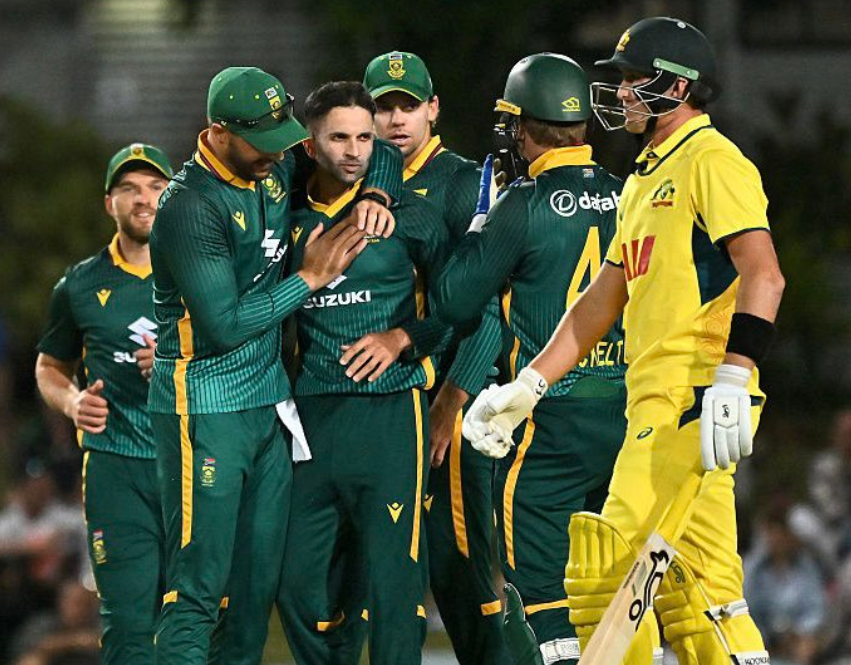
The South Africa National Cricket Team Vs Australian Men’s Cricket Team Match Scorecard from the first ODI of the 2026 Australia tour of South Africa records a competitive match at Kingsmead in Durban on September 24, 2026. Australia won the toss and elected to bowl first, but South Africa responded with an imposing 297 for eight in their allotted 50 overs. Matthew Breetzke produced the standout batting performance, scoring 112 from 106 deliveries, while Marco Jansen provided a powerful late contribution of 75 from 59 balls. Australia began its chase positively through Mitchell Marsh and Travis Head, but South Africa’s bowling attack steadily took control. Australia was eventually dismissed for 230 in 41.2 overs, giving South Africa a 67 run victory. Breetzke was named Player of the Match for his century. The contest contained several important individual performances. Breetzke’s 112 formed the backbone of the South African innings, while Jansen’s 75 accelerated the score during the closing overs. For Australia, Mitchell Marsh struck 60 from only 36 balls and Matt Renshaw contributed 44, but the visitors could not maintain their early scoring momentum. Keshav Maharaj was particularly effective with the ball, taking four wickets for 20 runs. Match Overview The first ODI was played at Kingsmead, Durban, on September 24, 2026, as part of Australia’s tour of South Africa. Australia won the toss and decided to bowl. South Africa’s opening partnership did not last long, with Tony de Zorzi dismissed for a duck and Quinton de Kock falling for 14. Temba Bavuma then joined Matthew Breetzke and helped stabilize the innings. Bavuma made 30 from 48 balls before being dismissed by Adam Zampa. Breetzke continued to build the innings and formed useful partnerships with Ryan Rickelton and David Miller. Breetzke eventually reached 112 from 106 balls, striking 14 fours and two sixes. His century gave South Africa a strong platform. Marco Jansen then delivered a powerful finishing performance, scoring 75 from 59 balls with seven fours and four sixes. Their contributions helped South Africa finish at 297 for eight. Australia’s chase started rapidly. Mitchell Marsh and Travis Head produced an opening partnership worth 90 runs before Marsh was dismissed for 60. Head made 36, while Cooper Connolly scored 38 and Matt Renshaw added 44. However, South Africa’s spinners and seamers continued to take wickets, and Australia eventually fell to 230 all out in 41.2 overs. South Africa Batting Scorecard South Africa Batter Runs Balls Fours Sixes Strike Rate Quinton de Kock 14 18 1 1 77.78 Tony de Zorzi 0 7 0 0 0.00 Temba Bavuma 30 48 4 0 62.50 Matthew Breetzke 112 106 14 2 105.66 Ryan Rickelton 27 26 4 0 103.85 David Miller 9 25 0 0 36.00 Marco Jansen 75 59 7 4 127.12 Corbin Bosch 9* 6 1 0 150.00 Gerald Coetzee 6 4 0 1 150.00 Bjorn Fortuin 1* 1 0 0 100.00 Keshav Maharaj Did not bat Extras 14 Total 297/8 50 overs Matthew Breetzke was the central figure in South Africa’s batting effort. His 112 from 106 balls was his first century in the match and provided the innings with stability after South Africa lost two early wickets. He controlled the middle overs effectively and increased the scoring rate whenever Australia attempted to apply pressure. Marco Jansen then transformed the innings during the final phase. His 75 from 59 balls included four sixes and seven fours. Jansen’s aggressive approach ensured South Africa crossed the 290 mark after the innings had been in a more cautious position during the middle overs. The partnership between Breetzke and Jansen was particularly significant. Breetzke supplied the foundation, while Jansen accelerated the scoring rate. South Africa ultimately reached 297 for eight, giving Australia a demanding target of 298. Australia Bowling Scorecard Australian Bowler Overs Maidens Runs Wickets Economy Mitchell Starc 10 0 60 0 6.00 Josh Hazlewood 10 2 50 1 5.00 Nathan Ellis 10 0 57 3 5.70 Jack Edwards 10 0 56 0 5.60 Adam Zampa 7 0 50 2 7.14 Cooper Connolly 1 0 7 0 7.00 Matt Renshaw 2 0 11 0 5.50 Nathan Ellis was Australia’s leading wicket taker with three wickets for 57 runs from his 10 overs. Adam Zampa also claimed two wickets, while Josh Hazlewood took one. However, South Africa’s late acceleration meant that Australia’s bowlers could not prevent the home side from reaching a total close to 300. Australia’s bowling attack initially created pressure by removing de Zorzi and de Kock relatively early. Zampa then dismissed Bavuma and Rickelton, but Breetzke and Jansen ensured that the South African innings remained strong. Australia Batting Scorecard Australian Batter Runs Balls Fours Sixes Strike Rate Mitchell Marsh 60 36 5 6 166.67 Travis Head 36 37 5 0 97.30 Cooper Connolly 38 42 4 1 90.48 Josh Inglis 3 8 0 0 37.50 Matt Renshaw 44 49 6 0 89.80 Cameron Green 5 10 0 0 50.00 Jack Edwards 5 15 0 0 33.33 Mitchell Starc 16 27 2 0 59.26 Nathan Ellis 4 10 0 0 40.00 Adam Zampa 7 15 1 0 46.67 Josh Hazlewood 0* Extras 12 Total 230 41.2 overs Mitchell Marsh gave Australia an explosive beginning to the chase. His 60 came from just 36 deliveries, including five fours and six sixes. Travis Head supported him with 36, and their partnership gave Australia an excellent start. After Marsh’s dismissal at 90, however, Australia lost wickets more regularly. Head fell at 129, Josh Inglis was dismissed shortly afterward, and the middle order could not establish another major partnership. Matt Renshaw’s 44 and Cooper Connolly’s 38 helped extend the chase, but South Africa continued to apply pressure. Australia was eventually bowled out for 230 in 41.2 overs. The result meant South Africa won the opening ODI by 67 runs. South Africa Bowling Scorecard South Africa Bowler Overs Maidens Runs Wickets Economy Marco Jansen 7 0 64 1 9.14 Gerald Coetzee 8 1 40 1 5.00 Corbin Bosch 9 0 67 2 7.44 Keshav Maharaj 9.2 2

West Indies Cricket Team Vs South Africa National Cricket Team Match Scorecard

The West Indies Cricket Team Vs South Africa National Cricket Team Match Scorecard from the 2026 ICC Men’s T20 World Cup Super Eight match records a dominant South African chase at the Narendra Modi Stadium in Ahmedabad on February 26, 2026. West Indies batted first after South Africa won the toss and posted 176 for 8 in their 20 overs. Romario Shepherd top-scored with an unbeaten 52 from 37 balls, while Jason Holder added 49 from 31 deliveries. South Africa responded strongly, reaching 177 for 1 in only 16.1 overs and winning by nine wickets. Aiden Markram remained unbeaten on 82 from 46 balls, while Ryan Rickelton finished unbeaten on 45 from 28. Quinton de Kock contributed 47 from 24 balls before being dismissed. The result was decided largely by South Africa’s aggressive opening partnership and Markram’s controlled innings. Quinton de Kock and Markram added 95 before de Kock fell, after which Markram and Rickelton completed the chase. The match also provided another important chapter in the T20 World Cup rivalry between the two sides. Match Overview South Africa won the toss and elected to bowl first at the Narendra Modi Stadium. West Indies began aggressively, but South Africa’s bowlers regularly took wickets during the first half of the innings. Shai Hope scored 16 from six balls and Brandon King made 21 from 11, but both were dismissed early. West Indies slipped to 83 for seven before Jason Holder and Romario Shepherd rebuilt the innings. Holder scored 49 from 31 balls with four fours and three sixes, while Shepherd remained unbeaten on 52 from 37 deliveries. Their partnership helped West Indies reach 176 for eight from 20 overs. South Africa’s reply was considerably more controlled. De Kock scored 47 from 24 balls, and Markram continued at an excellent scoring rate. After de Kock was dismissed at 95, Ryan Rickelton joined Markram and the pair completed the chase in 16.1 overs. South Africa finished on 177 for one, winning with 23 balls remaining. West Indies Batting Scorecard West Indies Batter Runs Balls 4s 6s Strike Rate Brandon King 21 11 5 0 190.91 Shai Hope 16 6 1 2 266.67 Shimron Hetmyer 2 3 0 0 66.67 Rovman Powell 9 11 1 0 81.82 Roston Chase 2 2 0 0 100.00 Sherfane Rutherford 12 10 0 1 120.00 Jason Holder 49 31 4 3 158.06 Matthew Forde 11 9 1 1 122.22 Romario Shepherd 52* 37 3 4 140.54 Gudakesh Motie 0* — 0 0 — Shamar Joseph Did not bat — — — — Extras 2 — — — — Total 176/8 20 overs — — — Romario Shepherd was the leading scorer for West Indies with 52 not out. His innings contained three fours and four sixes and provided the late acceleration required to push the total toward 177. Jason Holder was also crucial, scoring 49 from 31 balls. The West Indies innings was interrupted by regular wickets. South Africa’s Lungi Ngidi took three wickets, while Kagiso Rabada and Corbin Bosch claimed two each. Their bowling prevented West Indies from building a sustained partnership through the middle overs. South Africa Bowling Scorecard South Africa Bowler Overs Runs Wickets Economy Keshav Maharaj 4 43 0 10.80 Marco Jansen 4 50 0 12.50 Kagiso Rabada 4 22 2 5.50 Lungi Ngidi 4 30 3 7.50 Corbin Bosch 4 31 2 7.75 Lungi Ngidi produced the best wicket-taking figures for South Africa, finishing with three wickets for 30 runs. Kagiso Rabada and Corbin Bosch provided further breakthroughs, taking two wickets each. Rabada was particularly economical, conceding only 22 runs from his four overs. South Africa’s bowling effort was important because West Indies had several explosive batters capable of increasing the scoring rate quickly. By taking wickets at regular intervals, South Africa limited the damage before Holder and Shepherd launched their late attack. South Africa Batting Scorecard South Africa Batter Runs Balls 4s 6s Strike Rate Aiden Markram 82* 46 7 4 178.26 Quinton de Kock 47 24 4 4 195.83 Ryan Rickelton 45* 28 4 2 160.71 Dewald Brevis Did not bat — — — — David Miller Did not bat — — — — Tristan Stubbs Did not bat — — — — Marco Jansen Did not bat — — — — Corbin Bosch Did not bat — — — — Kagiso Rabada Did not bat — — — — Keshav Maharaj Did not bat — — — — Lungi Ngidi Did not bat — — — — Extras 3 — — — — Total 177/1 16.1 overs — — — Aiden Markram was the standout batter of the match. He scored 82 not out from 46 balls, striking seven fours and four sixes. His innings combined boundary hitting with controlled running between the wickets and allowed South Africa to maintain a very high scoring rate throughout the chase. He was also named Player of the Match. Quinton de Kock provided the initial acceleration with 47 from only 24 balls. After his dismissal at 95, Rickelton joined Markram and scored an unbeaten 45 from 28 balls. The pair ensured that South Africa completed the chase without any late pressure. West Indies Bowling Scorecard West Indies Bowler Overs Runs Wickets Economy Matthew Forde 3 30 0 10.00 Romario Shepherd 2 22 0 11.00 Jason Holder 3.1 31 0 9.80 Shamar Joseph 2 24 0 12.00 Gudakesh Motie 2 24 0 12.00 Roston Chase 4 46 1 11.50 Roston Chase was the only West Indies bowler to take a wicket, dismissing Quinton de Kock. However, the rest of the attack could not prevent South Africa from scoring rapidly. Markram and Rickelton maintained the required rate and brought the target within reach well before the final over. South Africa’s batting rate made the difference. West Indies scored 176 from their 20 overs, but South Africa reached 177 in only 16.1 overs. This meant that the South African chase required a sustained scoring rate without giving the opposition many opportunities to recover. Key Performances

Australian Men’s Cricket Team Vs West Indies Cricket Team Match Scorecard

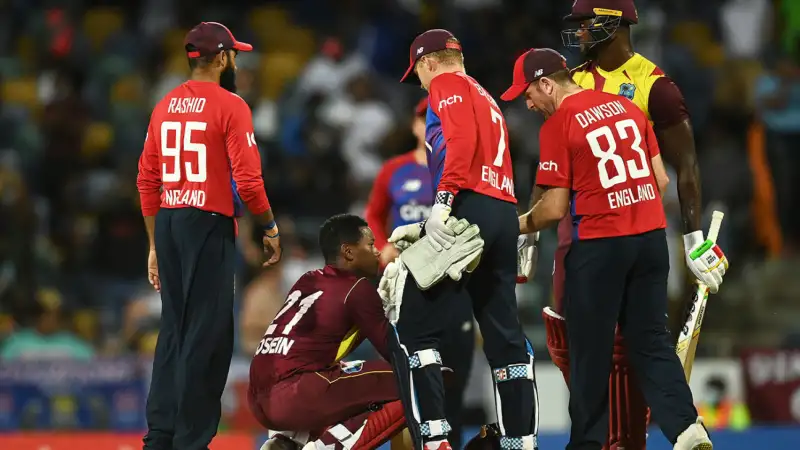
The Australian Men’s Cricket Team Vs West Indies Cricket Team Match Scorecard from the second Test of the 2024 series records one of the most dramatic matches between the two sides in recent Test cricket. Played at the Gabba in Brisbane from January 25 to 28, 2024, the match ended with West Indies defeating Australia by just eight runs. West Indies scored 311 in their first innings before Australia replied with 289 for nine declared. The visitors then made 193 in their second innings, leaving Australia a target of 216. Australia appeared capable of completing the chase, but West Indies fast bowler Shamar Joseph produced an extraordinary spell of seven wickets for 68 runs to bowl Australia out for 207. The result was especially significant because West Indies had not won a Test in Australia since 1997. Joseph’s performance therefore became the defining feature of the match, while Steve Smith remained unbeaten on 91 in Australia’s second innings. The eight-run margin made the contest one of the closest finishes in recent Australia West Indies Test history. Match Overview West Indies won the toss and chose to bat first at the Gabba. Their opening innings eventually reached 311 all out after 108 overs. Kavem Hodge made 71, Joshua Da Silva scored 79, and Kevin Sinclair contributed 50. Alzarri Joseph also added a rapid 32 from 22 balls to strengthen the lower order. Australia’s first innings produced 289 for nine declared from 53 overs. Steve Smith remained unbeaten on 91, while Cameron Green scored 42. Mitchell Starc added a quick 21 from 14 balls as Australia attempted to establish a first innings advantage. West Indies therefore held a 22-run lead before their second innings. West Indies were dismissed for 193 in their second innings, leaving Australia 216 runs to win. Australia reached 207 before being bowled out, falling only nine runs short of the target mathematically but losing the match by eight runs after the final wicket. West Indies First Innings Scorecard West Indies Batter Runs Balls Result Kraigg Brathwaite 4 25 Dismissed Tagenarine Chanderpaul 21 48 Dismissed Kirk McKenzie 21 25 Dismissed Alick Athanaze 8 22 Dismissed Kavem Hodge 71 194 Dismissed Justin Greaves 6 10 Dismissed Joshua Da Silva 79 157 Dismissed Kevin Sinclair 50 98 Dismissed Alzarri Joseph 32 22 Dismissed Kemar Roach 8 40 Run out Shamar Joseph 3 9 Not out Extras 8 — — Total 311 108 overs All out Kavem Hodge and Joshua Da Silva were central to the West Indies first innings. Hodge’s 71 came from 194 balls, while Da Silva scored 79 from 157 deliveries. Their contributions helped West Indies recover from several early setbacks and reach 311. Australia’s Mitchell Starc was particularly effective, taking four wickets in the innings. Nathan Lyon claimed two wickets, while Josh Hazlewood and Pat Cummins also contributed with important breakthroughs. Australia First Innings Scorecard Australia Batter Runs Balls Result Usman Khawaja 75 — Dismissed David Warner 8 — Dismissed Marnus Labuschagne 3 — Dismissed Steve Smith 91 146 Not out Cameron Green 42 73 Dismissed Travis Head 0 1 Dismissed Mitchell Marsh 10 12 Dismissed Alex Carey 2 5 Dismissed Mitchell Starc 21 14 Dismissed Pat Cummins 2 8 Dismissed Nathan Lyon 9 20 Dismissed Josh Hazlewood Did not bat — — Total 289/9 53 overs Declared Australia’s first innings was led by Steve Smith, who remained unbeaten on 91. Cameron Green supplied valuable support with 42, while the lower order accelerated the scoring rate before Australia declared at 289 for nine. The declaration gave West Indies an opportunity to build a defendable fourth innings target. Although the visitors were eventually dismissed for 193, they had created enough pressure to leave Australia needing 216 for victory. West Indies Second Innings Scorecard West Indies Batter Runs Result Kraigg Brathwaite 16 Dismissed Tagenarine Chanderpaul 12 Dismissed Kirk McKenzie 3 Dismissed Alick Athanaze 35 Dismissed Kavem Hodge 15 Dismissed Justin Greaves 5 Dismissed Joshua Da Silva 17 Dismissed Kevin Sinclair 5 Dismissed Alzarri Joseph 9 Dismissed Kemar Roach 5 Dismissed Shamar Joseph 15 Not out Extras Included — Total 193 72.3 overs West Indies’ second innings was considerably shorter than their first. The Australian bowlers kept taking wickets and eventually restricted the visitors to 193. Australia therefore appeared to have a manageable target of 216. However, the relatively low target became difficult once Shamar Joseph began attacking Australia’s middle and lower order. His bowling spell ultimately changed the match completely. Australia Second Innings Scorecard Australia Batter Runs Result Usman Khawaja 10 Dismissed Marnus Labuschagne 5 Dismissed Steve Smith 91 Not out Cameron Green 42 Dismissed Travis Head 0 Dismissed Mitchell Marsh 10 Dismissed Alex Carey 2 Dismissed Mitchell Starc 21 Dismissed Pat Cummins 2 Dismissed Nathan Lyon 9 Dismissed Josh Hazlewood 0 Dismissed Extras 15 — Total 207 50.5 overs Steve Smith again produced Australia’s highest score, finishing unbeaten on 91 from 146 balls. Cameron Green made 42, while Mitchell Starc scored a quick 21. The Australian innings appeared to be progressing toward victory while Smith remained at the crease. However, Shamar Joseph removed key batters in a remarkable spell and eventually dismissed Josh Hazlewood to complete the Australian innings at 207. Bowling Performance and Key Records Shamar Joseph was the outstanding bowler of the match. He took seven wickets for 68 runs in Australia’s second innings, producing one of the most memorable spells by a West Indies fast bowler in Australia. His performance earned him the Player of the Match award. West Indies Bowler Wickets Shamar Joseph 7 Alzarri Joseph 2 Justin Greaves 1 For Australia, Mitchell Starc was particularly effective during West Indies’ first innings, while Nathan Lyon also contributed wickets. The match ultimately demonstrated how a Test can change rapidly even when the chasing side requires fewer than 250 runs. The final figures were West Indies 311 and 193, against Australia’s 289 for nine declared and 207 all out. West Indies won by eight runs, leveling the two-match Test series 1–1. Conclusion The Australian Men’s Cricket

Australian Men’s Cricket Team Vs Netherlands Cricket Team Match Scorecard

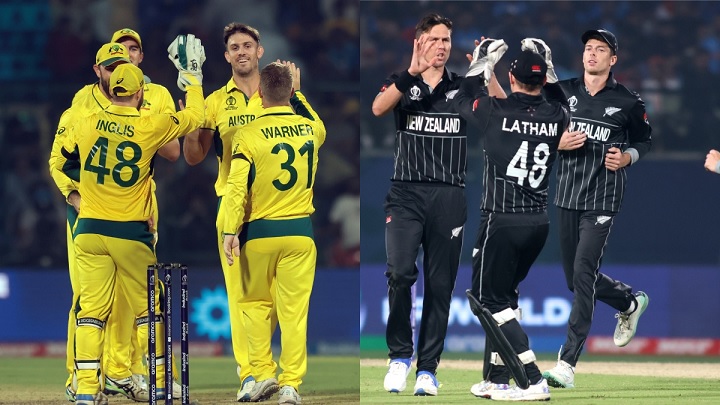
The Australian Men’s Cricket Team Vs Netherlands Cricket Team Match Scorecard provides a detailed look at one of the most dominant performances of the 2023 ICC Men’s Cricket World Cup. Australia faced the Netherlands in the 24th match of the tournament at Arun Jaitley Stadium in Delhi on October 25, 2023. Australia won the toss and chose to bat first, setting an imposing target after scoring 399 runs for eight wickets in their allotted 50 overs. The innings featured centuries from David Warner and Glenn Maxwell, while Steve Smith and Marnus Labuschagne also made valuable contributions. Netherlands were then bowled out for just 90 runs in 21 overs. Australia therefore secured a 309 run victory, which was the largest winning margin by runs in the history of the Men’s Cricket World Cup at that time. The match became particularly memorable because of Glenn Maxwell’s extraordinary century. He reached three figures from only 40 balls, setting the record for the fastest century in Men’s Cricket World Cup history at that time. David Warner also continued his excellent tournament with another hundred. At the other end, Adam Zampa played a major role with four wickets for only eight runs as the Netherlands batting order struggled against Australia’s bowling attack. Match Overview Australia entered the contest after defeats in their first two World Cup matches, while the Netherlands were also looking for a strong performance against one of the tournament’s established teams. The Australian side, led by Pat Cummins, had a strong batting lineup featuring David Warner, Mitchell Marsh, Steve Smith, Marnus Labuschagne and Glenn Maxwell. After winning the toss, Australia decided to bat. Mitchell Marsh was dismissed for nine, but Warner and Smith rebuilt the innings. Warner eventually scored 104 from 93 deliveries, while Smith contributed 71. Labuschagne added 62, creating the platform for a powerful finish. Maxwell then produced the defining performance of the match. He scored 106 from only 44 balls, including eight sixes, and his century came from 40 deliveries. Australia finished with 399 for eight from their 50 overs. Netherlands faced an enormous target of 400. Their innings never developed momentum, and the Australian bowlers repeatedly created breakthroughs. Adam Zampa finished with four wickets for eight runs, while Mitchell Marsh took two wickets. Netherlands were dismissed for 90 in only 21 overs. Australia Batting Scorecard Australian Batter Runs Balls Result David Warner 104 93 Dismissed Mitchell Marsh 9 15 Dismissed Steve Smith 71 68 Dismissed Marnus Labuschagne 62 47 Dismissed Josh Inglis 6 11 Dismissed Glenn Maxwell 106 44 Dismissed Cameron Green 8 12 Dismissed Pat Cummins 12 9 Dismissed Mitchell Starc 0 1 Not out Josh Hazlewood 0 0 Not out Adam Zampa Did not bat — — Extras Included — — Total 399/8 50 overs — Australia’s batting effort was built around several substantial contributions rather than a single innings alone. Warner’s 104 provided the foundation, while Smith and Labuschagne maintained the scoring rate through the middle overs. Maxwell’s late acceleration transformed a strong total into an enormous one. Maxwell’s 106 from 44 balls included a remarkable collection of boundaries and became the standout individual innings of the match. The ICC recorded his 40 ball century as the fastest century in Men’s Cricket World Cup history at that point. Netherlands Bowling Performance The Netherlands bowling attack faced a difficult challenge after Australia established a strong position during the opening half of the innings. The Dutch bowlers attempted to slow Australia’s scoring rate through a combination of pace and spin, but Australia’s middle and lower order accelerated significantly during the final stages. Bas de Leede had a particularly difficult day with the ball. He conceded 115 runs in his 10 overs, becoming the first bowler to concede more than 100 runs in a Men’s ODI World Cup match. Australia’s ability to attack throughout the innings meant that the Netherlands struggled to maintain control during the final overs. The bowling figures can be summarized as follows. Netherlands Bowler Overs Runs Conceded Wickets Aryan Dutt 10 59 0 Logan van Beek 10 74 1 Paul van Meekeren 9 64 2 Bas de Leede 10 115 2 Roelof van der Merwe 10 53 1 Colin Ackermann 1 8 0 The Netherlands bowlers eventually claimed wickets, but the required pressure was difficult to maintain against Australia’s deep batting lineup. Maxwell’s attack in particular changed the complexion of the innings. Netherlands Batting Scorecard Netherlands Batter Runs Result Vikramjit Singh 25 Dismissed Max O’Dowd 6 Dismissed Colin Ackermann 10 Dismissed Bas de Leede 4 Dismissed Teja Nidamanuru 14 Dismissed Scott Edwards 12 Not out Sybrand Engelbrecht 11 Dismissed Logan van Beek 0 Dismissed Roelof van der Merwe 0 Dismissed Aryan Dutt 0 Dismissed Paul van Meekeren 0 Dismissed Extras Included — Total 90 21 overs Netherlands found it extremely difficult to respond to the 400 run target. Vikramjit Singh was the top scorer with 25, while captain Scott Edwards remained unbeaten on 12. The lower order could not establish a meaningful partnership as Australia’s bowling attack continued to take wickets at regular intervals. The Netherlands were eventually bowled out for 90. Australia Bowling Scorecard Australian Bowler Overs Runs Conceded Wickets Mitchell Starc 6 27 1 Josh Hazlewood 6 40 1 Pat Cummins 5 21 1 Mitchell Marsh 4 19 2 Glenn Maxwell 0 0 0 Adam Zampa 3 8 4 Adam Zampa produced the best bowling figures of the match with four wickets for eight runs from three overs. His spell accelerated the collapse and helped Australia dismiss Netherlands inside 21 overs. Mitchell Marsh also contributed with two wickets, while Starc, Hazlewood and Cummins each claimed one. The Australian bowling performance demonstrated the value of maintaining pressure after setting a large total. The Netherlands needed 400 runs for victory, but Australia’s pace attack removed early batters before Zampa completed the collapse. The 309 run victory remains a significant World Cup scorecard because of its unusually large margin. Key Performances and Records Several individual performances made this match memorable. David Warner scored 104

How Durable Golf Course Accessories Reduce Long-Term Maintenance Costs

Managing a premier golf facility requires a careful balance between delivering a world-class player experience and controlling operational expenditures.  While turf management and irrigation systems often dominate facility budgets, the equipment placed around the grounds plays a surprisingly critical role in financial health.  Investing in high-grade golf course accessories significantly reduces long-term maintenance costs, minimizes repair overhead, and ensures sustainable facility operations over time. Resisting Environmental Wear Through Premium Material Selection Equipment placed outdoors faces relentless exposure to harsh ultraviolet sunlight, heavy rainfall, freezing temperatures, and aggressive lawn maintenance machinery.  Cheaply manufactured products degrade rapidly under these extreme environmental conditions, requiring constant patching, repainting, or full replacements.  Selecting durable golf course accessories crafted from powder-coated aluminum, UV-stabilized polymers, and marine-grade stainless steel prevents rust, cracking, and fading. High-end materials withstand weather extremes effortlessly, drastically lowering the frequency of premature equipment failures. Minimizing Daily Repair Labor and Staff Intervention Hours Facility groundskeeping and maintenance crews operate on strict schedules with limited time for tedious, repetitive equipment upkeep. Flimsy ball washers, broken trash receptacles, and loose tee markers demand constant attention and quick fixes from busy staff members.  Robustly engineered equipment features secure fastening mechanisms and reliable moving parts that require minimal manual intervention.  Choosing heavy-duty golf course accessories frees up valuable staff hours, allowing maintenance teams to focus their energy on core turf health and greenkeeping tasks. Lowering Replacement Frequency and Driving Financial Efficiency The temptation to purchase inexpensive, low-quality facility equipment often backfires when products break down within a single operating season. Constantly buying replacement parts or entirely new units accumulates massive hidden costs that far exceed the initial savings.  Investing in premium golf course accessories offers a superior return on investment by providing exceptional longevity. Superior craftsmanship ensures that every dollar spent contributes directly to long-term financial efficiency and reduced capital expenditure. Withstanding Accidental Impacts and Heavy Daily Usage Golf courses experience constant physical traffic from players, golf carts, and maintenance vehicles that occasionally bump into tee markers and signage. Fragile materials shatter or dent easily upon impact, creating unsightly hazards and safety concerns that demand immediate replacement.  Sturdy, impact-resistant manufacturing absorbs minor collisions without structural damage. Ensuring resilience against physical wear and tear protects the club from unnecessary recurring replacement expenses. Simplifying Routine Cleaning and Preventive Care Workflows Maintenance costs involve not only purchasing replacement items but also the labor and cleaning supplies required to keep fixtures looking professional. Porous materials absorb dirt, stains, and chemicals, making them difficult to clean and prone to permanent discoloration over time.  Smooth, stain-resistant surfaces simplify routine washdowns and sanitation processes. Easy-to-maintain golf course accessories reduce chemical cleaning expenses and maintain an immaculate club appearance with minimal effort. Protecting Club Reputation and Ensuring Long-Term Value Broken or rusted equipment creates a poor first impression, signaling to members and tournament guests a lack of attention to operational quality.  Maintaining pristine on-course fixtures preserves the elite reputation and prestige of the facility without requiring emergency budget allocations for sudden upgrades.  Proactive investments in durable infrastructure guarantee that your property remains visually stunning, operationally efficient, and financially secure for years to come.

SportsShave.com brings you the latest sports news, match updates, player insights, team coverage, scores, and trending stories from the world of sports. Stay informed and connected with everything happening in sports.

© 2026 Created with SportsShave.com