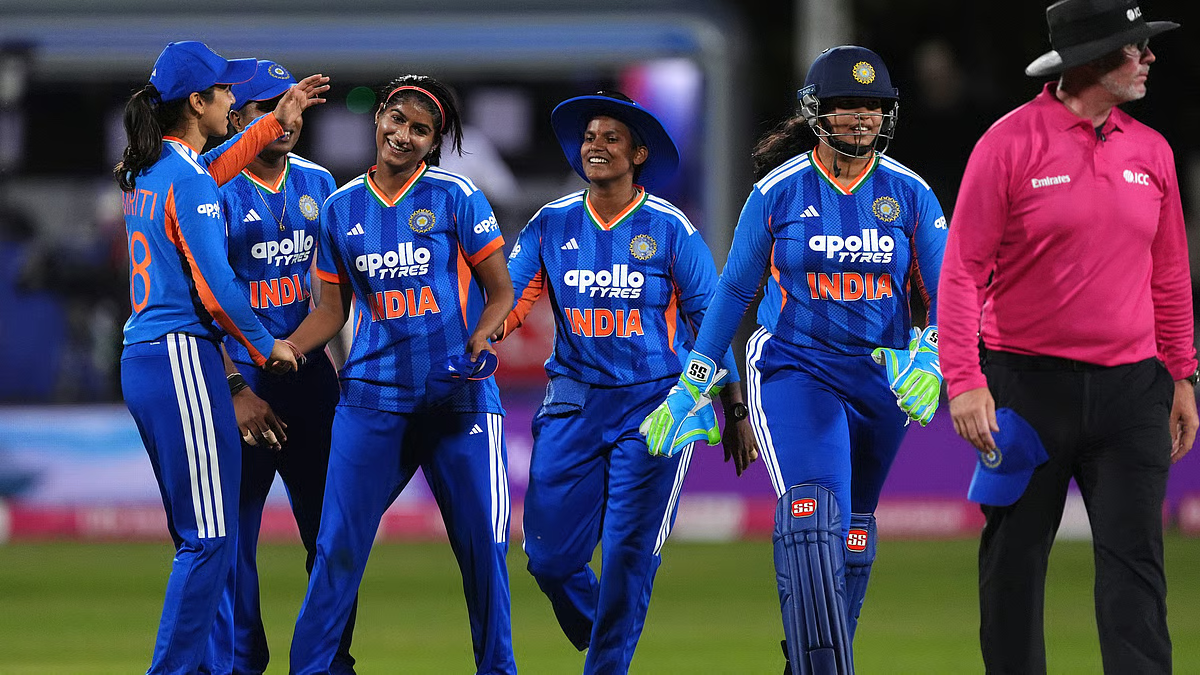
India A Cricket Team Vs United Arab Emirates National Cricket Team Match Scorecard

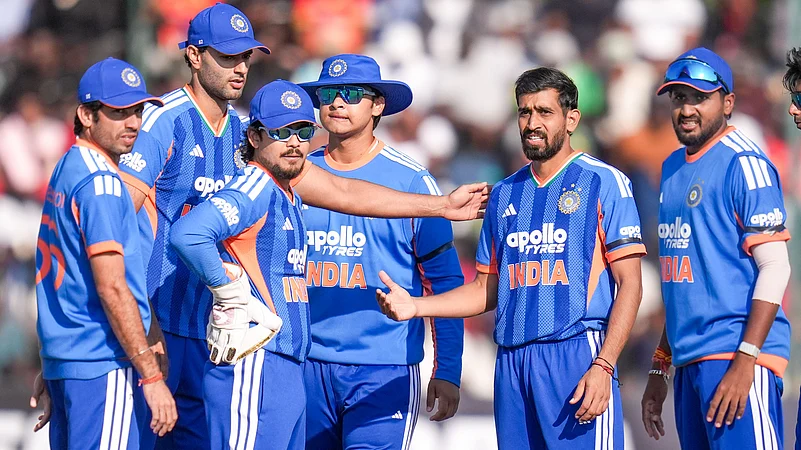
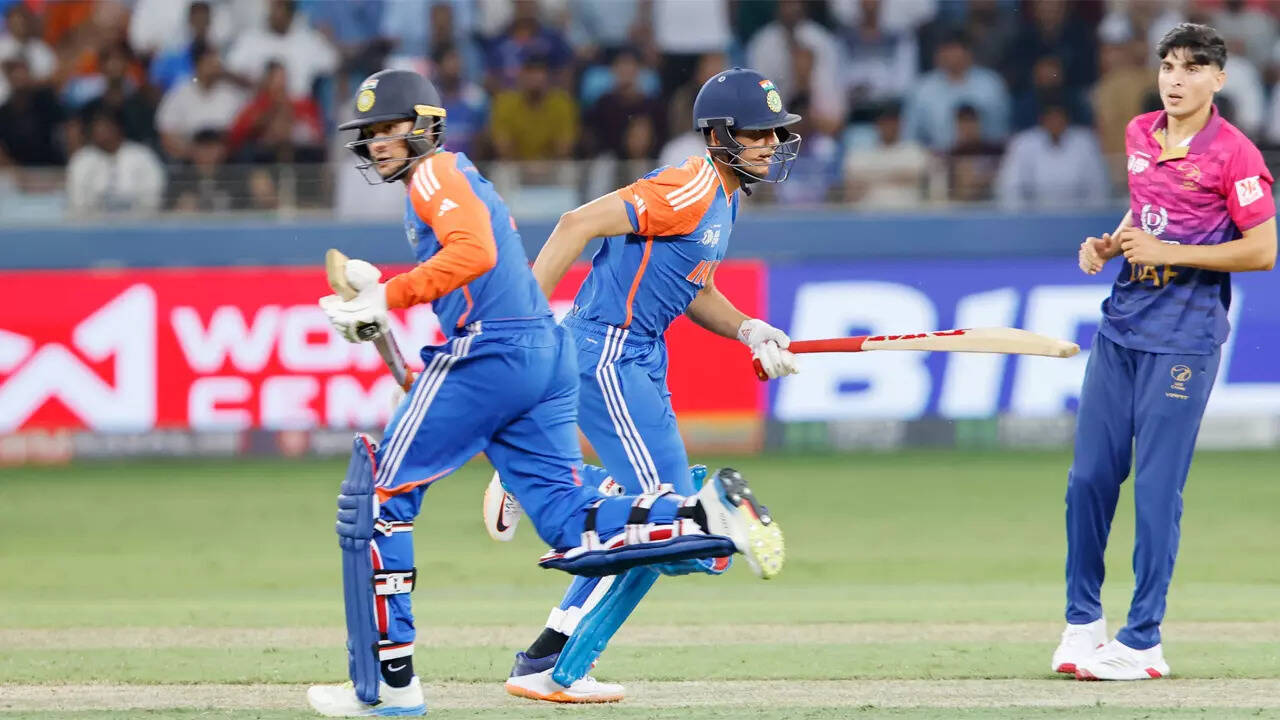
The India A Cricket Team Vs United Arab Emirates National Cricket Team Match Scorecard from the Asia Cup Rising Stars 2025 records one of the most dominant T20 performances by India A. The match was played on 14 November 2025 at the West End Park International Cricket Stadium in Doha. India A won the toss and chose to bat first, eventually posting a massive 297/4 in 20 overs. Vaibhav Sooryavanshi produced the headline performance with an extraordinary 144 runs from just 42 balls, including 11 fours and 15 sixes. Captain Jitesh Sharma added an unbeaten 83 from 32 balls as India A finished just short of the 300-run mark.https://sportsshave.com/ United Arab Emirates responded with 149/7 in 20 overs. Sohaib Khan top-scored for UAE with 63 from 41 balls, but Gurjapneet Singh’s 3/18 and disciplined spells from the other India A bowlers kept the chase well behind the required rate. India A eventually won by 148 runs. Match Overview The match was the second game of Group B in the Asia Cup Rising Stars 2025. It was a 20-over contest between India A and the United Arab Emirates at the West End Park International Cricket Stadium, Doha. Match Detail Information Match India A vs United Arab Emirates Tournament Asia Cup Rising Stars 2025 Stage Match 2, Group B Date 14 November 2025 Venue West End Park International Cricket Stadium, Doha Format T20 Toss India A won and elected to bat India A Score 297/4 in 20 overs UAE Score 149/7 in 20 overs Result India A won by 148 runs Player of the Match Vaibhav Sooryavanshi Highest Score Vaibhav Sooryavanshi – 144 Best Bowling Gurjapneet Singh – 3/18 Match Result and Summary India A dominated the match from the opening overs. After losing Priyansh Arya early, Vaibhav Sooryavanshi took complete control of the innings. His attacking strokeplay allowed India A to maintain an exceptional scoring rate throughout the first innings. Sooryavanshi scored 144 from 42 deliveries, striking 11 fours and 15 sixes. His innings came at a strike rate of 342.86 and formed the foundation of India’s enormous total. Naman Dhir provided valuable support with 34 from 23 balls, while Jitesh Sharma finished the innings in spectacular fashion. The India A captain remained unbeaten on 83 from only 32 deliveries. India A ended on 297/4, giving UAE a required run rate of almost 15 runs per over. The UAE innings never developed enough momentum. Sohaib Khan played the leading role with 63 from 41 balls, but wickets at regular intervals prevented UAE from mounting a serious chase. UAE eventually reached 149/7 after 20 overs. The final margin was therefore 148 runs in India’s favour. India A First Innings Scorecard India A’s batting scorecard was dominated by the spectacular performances of Vaibhav Sooryavanshi and Jitesh Sharma. Batter Dismissal Runs Balls 4s 6s Strike Rate Vaibhav Sooryavanshi c Ahmed Tariq b Muhammad Farazuddin 144 42 11 15 342.86 Priyansh Arya run out 10 6 1 1 166.67 Naman Dhir c Muhammad Rohid b Muhammad Arfan 34 23 3 2 147.83 Jitesh Sharma not out 83 32 8 6 259.38 Nehal Wadhera c Muhammad Arfan b Aayan Afzal Khan 14 9 1 1 155.56 Ramandeep Singh not out 6 8 0 0 75.00 Extras — 6 — — — — Total 4 wickets 297 20 overs — — 14.85 RPO India A lost its first wicket at 16 runs, but the partnership between Sooryavanshi and Naman Dhir completely changed the match. The pair added 163 runs, allowing India A to accelerate to an imposing total. Sooryavanshi’s 144 was particularly remarkable because 134 of his runs came in boundaries. His 15 sixes were a major feature of the innings. Jitesh Sharma then ensured that the scoring rate remained extremely high after Sooryavanshi’s dismissal. His unbeaten 83 from 32 balls included eight fours and six sixes. India A Bowling Scorecard India A’s bowlers had the difficult task of defending 297. Gurjapneet Singh stood out with three wickets while conceding only 18 runs from his four overs. Bowler Overs Maidens Runs Wickets Economy Gurjapneet Singh 4 0 18 3 4.50 Yash Thakur 4 0 22 1 5.50 Ramandeep Singh 4 0 32 1 8.00 Harsh Dubey 2 0 12 2 6.00 Suyash Sharma 4 0 48 0 12.00 Naman Dhir 1 0 9 0 9.00 Nehal Wadhera 1 0 7 0 7.00 Gurjapneet Singh’s three-wicket spell was particularly important during the early part of UAE’s innings. He helped prevent the UAE batters from building the type of partnership required to challenge the huge target. Harsh Dubey also contributed two wickets from his two overs, while Yash Thakur and Ramandeep Singh claimed one wicket each. United Arab Emirates Innings Scorecard UAE finished on 149/7 from their allotted 20 overs. Batter Dismissal Runs Balls 4s 6s Strike Rate Mayank Rajesh Kumar c Wadhera b Harsh Dubey 18 22 1 1 81.82 Alishan Sharafu c Ramandeep Singh b Gurjapneet Singh 3 5 0 0 60.00 Ahmed Tariq lbw b Gurjapneet Singh 0 2 0 0 0.00 Sohaib Khan c Naman Dhir b Gurjapneet Singh 63 41 3 6 153.66 Harshit Kaushik b Harsh Dubey 0 1 0 0 0.00 Syed Haider c Ashutosh Sharma b Ramandeep Singh 20 16 1 1 125.00 Muhammad Arfan b Yash Thakur 26 26 3 0 100.00 Aayan Afzal Khan not out 2 3 0 0 66.67 Mohammed Faraazuddin not out 2 4 0 0 50.00 Extras — 15 — — — — Total 7 wickets 149 20 overs — — 7.45 RPO Sohaib Khan was the standout batter for UAE. His 63 off 41 balls included three fours and six sixes and represented the strongest individual resistance during the chase. However, UAE lost two wickets during the powerplay and continued to lose wickets at important moments. The required run rate was already extremely high, making recovery increasingly difficult. Fall of Wickets The fall of wickets illustrates how India A maintained control of the match. India A Fall of Wickets Wicket Score Batter Over
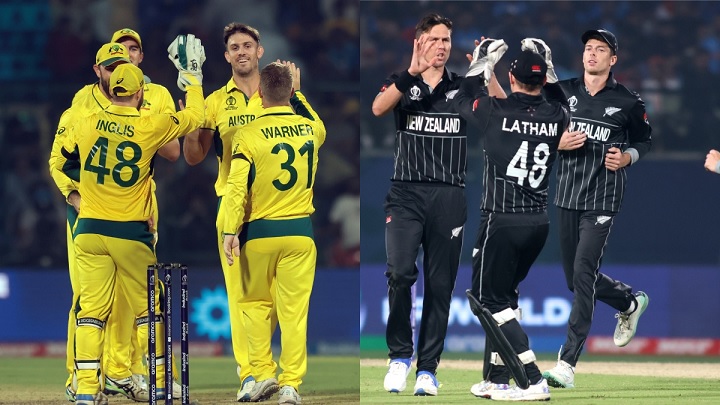
Australian Men’s Cricket Team Vs New Zealand National Cricket Team Match Scorecard

The Australian Men’s Cricket Team vs New Zealand National Cricket Team match scorecard for the latest completed men’s international records Australia’s three-wicket victory in the third T20I at Bay Oval, Mount Maunganui, on 4 October 2025. New Zealand scored 156/9 in 20 overs after being sent in to bat, while Australia chased the target in 18 overs, finishing on 160/7. Mitchell Marsh produced the defining performance of the match, scoring an unbeaten 103 from 52 balls. His innings included eight fours and seven sixes and helped Australia recover from 134/7 to reach the target with 12 balls remaining. Sean Abbott was Australia’s leading bowler with 3/25, while James Neesham took four wickets for New Zealand. Match Overview Australia won the toss and elected to bowl first at Bay Oval. New Zealand made 156/9 from their 20 overs, with Tim Seifert leading the scoring with 48 from 35 balls. New Zealand lost wickets regularly during the first half of the innings but recovered through contributions from Michael Bracewell and James Neesham. Bracewell scored 26 from 22 balls, while Neesham added 25 from 18 deliveries. Sean Abbott was Australia’s most successful bowler, taking three wickets for 25 runs. Josh Hazlewood and Xavier Bartlett claimed two wickets each. Australia’s chase began positively but became difficult after a sequence of wickets. Mitchell Marsh remained at the crease throughout the innings and scored 103 not out from 52 balls. Mitchell Owen added 14 and Sean Abbott finished unbeaten on 13 as Australia reached 160/7 in 18 overs. Match Detail Information Match Australia Men vs New Zealand Men Series Australia tour of New Zealand 2025 Match 3rd T20I Date 4 October 2025 Venue Bay Oval, Mount Maunganui Toss Australia won and elected to bowl New Zealand Score 156/9 in 20 overs Australia Score 160/7 in 18 overs Result Australia won by 3 wickets Player of the Match Mitchell Marsh Player of the Series Mitchell Marsh Series Result Australia won 2–0 Match Result and Summary New Zealand made 156/9 after being put into bat. Tim Seifert gave the innings momentum with 48 from 35 deliveries, including five fours and three sixes. Australia’s bowlers kept New Zealand from building a major partnership. Abbott took three wickets, while Hazlewood and Bartlett took two each. Adam Zampa and Marcus Stoinis also claimed one wicket apiece. Australia’s chase was dominated by Mitchell Marsh. The Australian captain scored 103 not out from 52 balls at a strike rate of 198.08. He struck eight fours and seven sixes. Australia lost seven wickets, including six wickets for 83 runs after Marsh had helped establish the chase. However, Marsh remained unbeaten and guided Australia to 160/7 in 18 overs. Innings Score Overs Run Rate New Zealand 156/9 20.0 7.80 Australia 160/7 18.0 8.89 Result Australia won by 3 wickets — — New Zealand First Innings Scorecard Tim Seifert was New Zealand’s highest scorer with 48 from 35 balls. He hit five fours and three sixes before being dismissed by Xavier Bartlett. Michael Bracewell and James Neesham provided useful middle-order contributions, scoring 26 and 25 respectively. Batter Runs Balls 4s 6s Strike Rate Tim Seifert 48 35 5 3 137.14 Devon Conway 0 2 0 0 0.00 Tim Robinson 13 10 1 1 130.00 Mark Chapman 4 5 1 0 80.00 Daryl Mitchell 9 10 1 0 90.00 Michael Bracewell 26 22 2 1 118.18 James Neesham 25 18 2 2 138.89 Matt Henry 6 8 0 0 75.00 Ben Sears 0 2 0 0 0.00 Ish Sodhi 9* 7 0 1 128.57 Jacob Duffy 1* 1 0 0 100.00 Extras 15 — — — — Total 156/9 20 overs 7.80 RR New Zealand’s 46 runs in the powerplay gave them a reasonable platform, but wickets at regular intervals prevented the innings from developing into a much larger total. Seifert was the main source of boundaries at the top of the order. After his dismissal at 99/5, New Zealand received further runs from Neesham and Bracewell, although Australia continued to take wickets during the final overs. Australia Bowling Scorecard Sean Abbott produced the best bowling figures for Australia, taking three wickets for 25 runs in four overs. Hazlewood and Bartlett took two wickets each. Bowler Overs Maidens Runs Wickets Economy Josh Hazlewood 4 0 26 2 6.50 Xavier Bartlett 4 0 25 2 6.25 Sean Abbott 4 0 25 3 6.25 Adam Zampa 4 0 30 1 7.50 Marcus Stoinis 4 1 43 1 10.75 Abbott’s three wickets came at important stages, including the dismissals of Mark Chapman, Matt Henry and Ben Sears. Hazlewood’s two wickets came early in the innings, removing Devon Conway and Tim Robinson. Bartlett then accounted for Seifert and Neesham. Australia Second Innings Scorecard Mitchell Marsh produced one of the most notable T20I innings of his career, finishing unbeaten on 103 from 52 balls. His strike rate was 198.08, with eight fours and seven sixes. Marsh was supported by Mitchell Owen, who scored 14 from 10 balls, and Sean Abbott, who made an unbeaten 13 from seven deliveries. Batter Runs Balls 4s 6s Strike Rate Mitchell Marsh 103* 52 8 7 198.08 Travis Head 8 10 0 1 80.00 Matthew Short 7 12 1 0 58.33 Tim David 3 5 0 0 60.00 Alex Carey 1 3 0 0 33.33 Marcus Stoinis 2 4 0 0 50.00 Mitchell Owen 14 10 0 1 140.00 Xavier Bartlett 1 5 0 0 20.00 Sean Abbott 13* 7 2 0 185.71 Adam Zampa Did not bat — — — — Josh Hazlewood Did not bat — — — — Extras 8 — — — — Total 160/7 18 overs 8.89 RR Australia’s powerplay produced 62 runs, putting the chase ahead of the required rate. However, New Zealand fought back strongly through James Neesham, who took four wickets. Despite the collapse around him, Marsh maintained his attacking approach. His unbeaten century ultimately carried Australia across the finish line with two overs remaining. New Zealand Bowling Scorecard James Neesham was New Zealand’s leading bowler, taking four

England Cricket Team Vs Sri Lanka National Cricket Team Match Scorecard

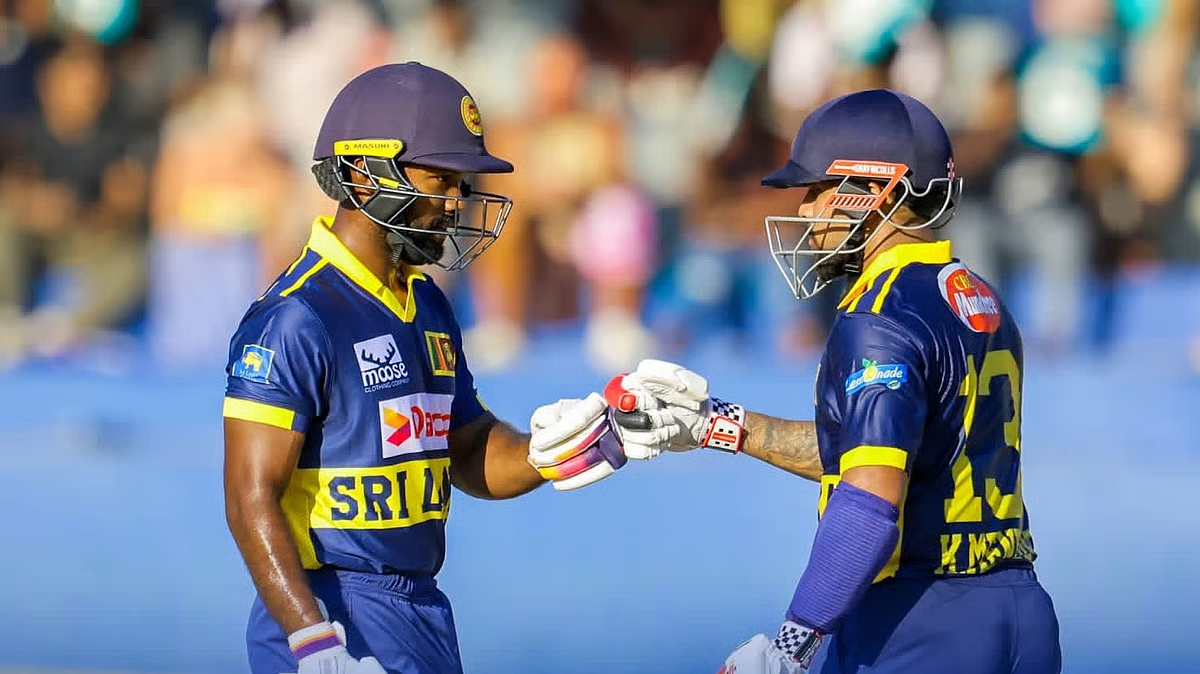
The England Cricket Team vs Sri Lanka National Cricket Team match scorecard for the latest completed ODI records a dominant 223-run victory for England in the third and deciding ODI at The Oval, London, on 27 September 2026. England posted 355/7 in 50 overs after winning the toss and choosing to bat, before dismissing Sri Lanka for 132 in 29.1 overs. Tom Banton was the star of England’s innings, scoring his maiden ODI century with 126 runs from 105 balls. Harry Brook added 77 and Jordan Cox scored 76, helping England build a formidable total. Liam Dawson then took 3/26 as Sri Lanka’s chase collapsed, with Kusal Mendis top-scoring for the visitors with 35. Match Overview The third ODI between England and Sri Lanka was played at The Kia Oval in London on 27 September 2026. England won the toss and elected to bat first. The hosts produced 355/7 from their 50 overs, giving Sri Lanka a challenging target of 356. England’s innings was built around a brilliant century from Tom Banton. After Ben Duckett was dismissed for a duck early in the innings, Banton formed important partnerships with Joe Root and Harry Brook. Brook scored 77 from 66 balls, while Jordan Cox added a rapid 76 from 52 balls. Sri Lanka’s reply lasted only 29.1 overs. Kusal Mendis made 35, Janith Liyanage scored 19 and Pavan Rathnayake contributed 18, but England’s bowlers kept taking wickets. Liam Dawson finished with three wickets, while Gus Atkinson took two. England completed a 223-run win and secured the three-match ODI series 2–1. Match Detail Information Match England vs Sri Lanka Series Sri Lanka tour of England 2026 Match 3rd ODI Date 27 September 2026 Venue The Kia Oval, London Toss England won and elected to bat England Score 355/7 in 50 overs Sri Lanka Score 132 all out in 29.1 overs Result England won by 223 runs Series Result England won 2–1 Highest Score Tom Banton – 126 Best Bowling Liam Dawson – 3/26 Match Result and Summary England began the decisive ODI with a difficult early moment when Ben Duckett was dismissed for a duck in the second over. Tom Banton responded by building the innings carefully before increasing the scoring rate. Banton reached his first ODI century and finished with 126 from 105 deliveries, including 16 fours and five sixes. His innings provided the foundation for England’s total of 355/7. Harry Brook scored 77 from 66 balls and shared a substantial partnership with Banton. Jordan Cox then accelerated the innings with 76 from 52 balls, helping England score heavily during the final overs. Sri Lanka’s chase never developed. Pathum Nissanka fell for one, Kamindu Mendis made 12 and Kusal Mendis scored 35. Once the wickets started falling, England’s bowlers maintained pressure and dismissed Sri Lanka for 132 in 29.1 overs. Innings Score Overs Run Rate England 355/7 50.0 7.10 Sri Lanka 132 all out 29.1 4.52 Victory Margin 223 runs — — England First Innings Scorecard England’s batting innings featured three major contributions. Banton’s 126 was the highest score, while Brook and Cox both passed 75. Banton’s innings came from 105 balls and contained 16 fours and five sixes. Brook struck nine fours and two sixes, while Cox hit six fours and two sixes at a strike rate above 146. Batter Runs Balls 4s 6s Strike Rate Tom Banton 126 105 16 5 120.00 Ben Duckett 0 5 0 0 0.00 Joe Root 18 37 1 0 48.65 Harry Brook 77 66 9 2 116.67 Jordan Cox 76 52 6 2 146.15 Will Jacks 25 21 2 1 119.05 Jamie Overton 21* 14 1 0 150.00 Liam Dawson 0 1 0 0 0.00 Gus Atkinson Did not bat — — — — Jofra Archer Did not bat — — — — Sonny Baker Did not bat — — — — Extras 12 — — — — Total 355/7 50 overs 7.10 RR The innings changed significantly after England lost Duckett early. Banton and Root rebuilt the score before Brook took over the attacking role. Banton and Brook then produced the main platform for the final acceleration. Jordan Cox continued the momentum after Brook’s dismissal, scoring 76 from only 52 balls. His innings helped England add substantial runs during the final phase. Sri Lanka Bowling Scorecard Asitha Fernando was Sri Lanka’s leading wicket-taker with three wickets. Sachindu Colombage took two wickets, while Dilshan Madushanka and Janith Liyanage claimed one each. Bowler Overs Maidens Runs Wickets Economy Asitha Fernando 9 0 64 3 7.11 Dilshan Madushanka 7 0 49 1 7.00 Eshan Malinga 9 0 65 0 7.22 Dunith Wellalage 9 1 62 0 6.88 Janith Liyanage 6 0 37 1 6.17 Sachindu Colombage 10 0 71 2 7.10 Fernando dismissed Harry Brook, Jordan Cox and Liam Dawson. Colombage removed Tom Banton and Will Jacks. Sri Lanka’s bowling figures show how difficult it was to contain England’s scoring. Every bowler conceded at least 37 runs, while England finished at 7.10 runs per over. Sri Lanka Second Innings Scorecard Sri Lanka needed 356 runs to win but lost Pathum Nissanka in the second over. Kamindu Mendis and Kusal Mendis attempted to rebuild the innings, but England continued to take wickets. Kusal Mendis was Sri Lanka’s highest scorer with 35 from 26 balls. Janith Liyanage made 19, while Pavan Rathnayake scored 18. Batter Runs Balls 4s 6s Strike Rate Pathum Nissanka 1 3 0 0 33.33 Kamindu Mendis 12 19 2 0 63.16 Kusal Mendis 35 26 2 3 134.62 Pavan Rathnayake 18 25 2 0 72.00 Charith Asalanka 7 19 0 0 36.84 Janith Liyanage 19 20 1 1 95.00 Dunith Wellalage 5 6 1 0 83.33 Sachindu Colombage 4 19 0 0 21.05 Eshan Malinga 14 19 2 0 73.68 Asitha Fernando 6 9 1 0 66.67 Dilshan Madushanka 2* 10 0 0 20.00 Total 132 all out 29.1 overs 4.52 RR Sri Lanka reached 77/4 before losing Charith Asalanka without adding to the score. The lower order could not provide a

England Women’s National Cricket Team Vs India Women’s National Cricket Team Match Scorecard

The England Women’s National Cricket Team vs India Women’s National Cricket Team match scorecard covers the one-off Women’s Test played at Lord’s Cricket Ground, London, from 10 July 2026. India Women produced a dominant performance to defeat England Women by 270 runs after scoring 285 in their first innings and declaring at 341/7 in the second innings. England were bowled out for 170 in their first innings and 186 in the second innings. Kranti Gaud was the standout performer with seven wickets in the match, including a five-wicket haul in England’s first innings. Yastika Bhatia also made a memorable contribution with a century in India’s second innings. Match Overview England Women won the toss and elected to bowl first at Lord’s. India responded with 285 all out in 74.5 overs, led by Smriti Mandhana’s 83, Harmanpreet Kaur’s 58 and Deepti Sharma’s 57. England’s first innings ended at 170 in 59.1 overs. Nat Sciver-Brunt scored 44 and Amy Jones made 52, but Kranti Gaud claimed five wickets to restrict the hosts. India then scored 341/7 declared in 86.3 overs. Yastika Bhatia scored 113, while Smriti Mandhana added 70 and Richa Ghosh finished unbeaten on 50. England were set a substantial target and were dismissed for 186 in their second innings. Sophie Ecclestone scored 50, Amy Jones made 54, but Sneh Rana took four wickets as India completed a 270-run victory. Match Detail Information Match England Women vs India Women Format Women’s Test Series India Women tour of England 2026 Date 10 July 2026 Venue Lord’s Cricket Ground, London Toss England Women won and elected to bowl India 1st Innings 285 all out England 1st Innings 170 all out India 2nd Innings 341/7 declared England 2nd Innings 186 all out Result India Women won by 270 runs Player of the Match Kranti Gaud Match Result and Summary India established control after scoring 285 in the first innings. Mandhana’s 83 was the highest score, while Harmanpreet Kaur and Deepti Sharma provided important middle-order contributions. England struggled against India’s bowling attack and were dismissed for 170. Nat Sciver-Brunt and Amy Jones offered resistance, but Kranti Gaud took five wickets and Sneh Rana claimed two. India’s second innings was highlighted by Yastika Bhatia’s 113. Mandhana scored another half-century, while Richa Ghosh made an unbeaten 50. India declared at 341/7, leaving England with a demanding target. England’s second innings lasted 62.5 overs. Jones and Ecclestone both reached 50, but Sneh Rana took four wickets and Deepti Sharma took two as India bowled England out for 186. Innings Score Overs Run Rate India Women 1st Innings 285 all out 74.5 3.81 England Women 1st Innings 170 all out 59.1 2.87 India Women 2nd Innings 341/7 declared 86.3 3.94 England Women 2nd Innings 186 all out 62.5 2.96 India Women First Innings Scorecard India’s first innings featured a strong contribution from the top and middle order. Smriti Mandhana scored 83 from 108 balls, including 11 fours and one six. Harmanpreet Kaur added 58 from 121 balls, while Deepti Sharma scored 57 from 87 deliveries. Jemimah Rodrigues contributed 35, helping India reach 285. Batter Runs Balls 4s 6s Strike Rate Smriti Mandhana 83 108 11 1 76.85 Shafali Verma 0 4 0 0 0.00 Yastika Bhatia 12 17 2 0 70.59 Jemimah Rodrigues 35 38 5 0 92.11 Harmanpreet Kaur 58 121 7 0 47.93 Deepti Sharma 57 87 7 0 65.52 Richa Ghosh 13 12 2 0 108.33 Sneh Rana 13 36 0 0 36.11 Sayali Satghare 1 23 0 0 4.35 Kranti Gaud 1 3 0 0 33.33 Sree Charani 3* 1 0 0 300.00 Extras 9 — — — — Total 285 all out 74.5 overs 3.81 RR India lost Shafali Verma for just four runs, but Mandhana and the middle order rebuilt the innings. The eventual total of 285 gave the Indian bowlers a solid platform to attack England. England Women Bowling Scorecard Sophie Ecclestone was England’s most successful bowler in India’s first innings, taking three wickets. Lauren Filer and Issy Wong took two wickets each. Bowler Overs Maidens Runs Wickets Economy Lauren Bell 9 0 50 1 5.56 Lauren Filer 13 1 40 2 3.08 Sophie Ecclestone 21.5 2 68 3 3.11 Issy Wong 12 0 41 2 3.42 Mady Villiers 19 1 79 2 4.16 Ecclestone’s three wickets came at an important stage, but India’s batting depth allowed the visitors to reach 285. England Women First Innings Scorecard England’s first innings was led by Amy Jones, who scored 52 from 62 balls. Nat Sciver-Brunt added 44, but the rest of the batting lineup struggled to build long partnerships. Batter Runs Balls 4s 6s Strike Rate Maia Bouchier 23 52 3 0 44.23 Tammy Beaumont 2 7 0 0 28.57 Heather Knight 6 25 1 0 24.00 Nat Sciver-Brunt 44 85 4 1 51.76 Alice Capsey 9 13 2 0 69.23 Amy Jones 52 62 6 0 83.87 Mady Villiers 10 33 0 0 30.30 Sophie Ecclestone 11 22 1 0 50.00 Issy Wong 7* 33 1 0 21.21 Lauren Bell 3 13 0 0 23.08 Lauren Filer 0 11 0 0 0.00 Extras 3 — — — — Total 170 all out 59.1 overs 2.87 RR England slipped to 32/3 early in the innings. Jones and Sciver-Brunt helped stabilize the innings, but India’s bowlers continued to take wickets at regular intervals. India Women Bowling Scorecard Kranti Gaud produced a five-wicket haul in England’s first innings, taking 5/37 from 17 overs. Sneh Rana and Sayali Satghare also took two wickets each. Bowler Overs Maidens Runs Wickets Economy Sayali Satghare 13 3 40 2 3.08 Kranti Gaud 17 7 37 5 2.18 Sneh Rana 14 3 41 2 2.93 Sree Charani 8 0 41 0 5.13 Deepti Sharma 7.1 2 10 1 1.40 Gaud’s seven maidens and five wickets made her spell one of the defining performances of the match. Her accuracy prevented England from establishing momentum. India Women Second Innings Scorecard India’s second innings was dominated by Yastika Bhatia, who scored 113 from

England Cricket Team Vs West Indies Cricket Team Match Scorecard

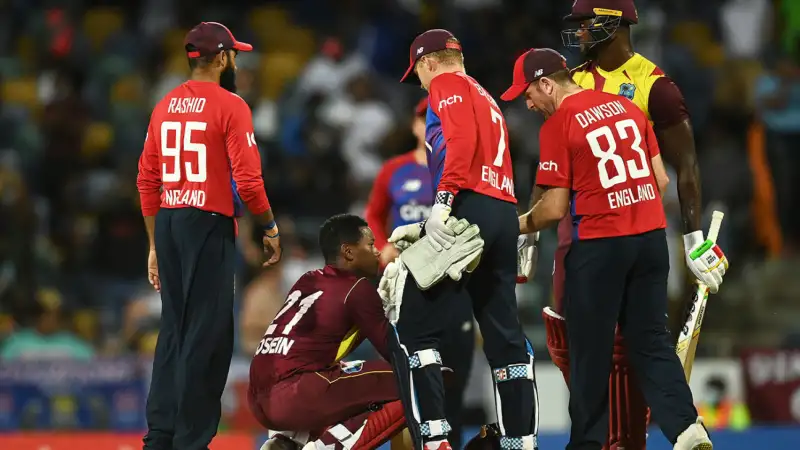
The England Cricket Team Vs West Indies Cricket Team Match Scorecard provides a detailed look at the teams’ encounter in the ICC Men’s T20 World Cup 2026. On 11 February 2026, West Indies defeated England by 30 runs in the 15th match of the tournament at Wankhede Stadium in Mumbai. West Indies scored 196/6 in 20 overs before restricting England to 166 all out in 19 overs. Sherfane Rutherford was named Player of the Match for his unbeaten 76 off 42 deliveries. The contest featured an impressive batting performance from West Indies, followed by a disciplined bowling display led by Gudakesh Motie and Roston Chase. England made a promising start to the chase, but regular wickets prevented the team from reaching the target. England vs West Indies Match Overview The match was played as part of the ICC Men’s T20 World Cup 2026. England won the toss and elected to field, giving West Indies the opportunity to bat first. Despite losing both openers early, West Indies recovered through a partnership involving Shimron Hetmyer and Roston Chase before Rutherford and Jason Holder accelerated the scoring in the later overs. Match Detail Information Match England vs West Indies Tournament ICC Men’s T20 World Cup 2026 Match Number 15th Match Date 11 February 2026 Venue Wankhede Stadium, Mumbai Match Format T20 International Toss England won and elected to field West Indies Score 196/6 in 20 overs England Score 166 all out in 19 overs Result West Indies won by 30 runs Player of the Match Sherfane Rutherford West Indies’ total of 196/6 gave England a challenging target of 197. England began aggressively but lost wickets at important stages. The West Indies spinners then applied pressure during the middle overs, helping their team secure the victory. West Indies Innings Scorecard West Indies finished their innings at 196/6, maintaining a scoring rate of 9.80 runs per over. The innings began with early dismissals, but the middle and lower order contributed important runs to build a competitive total. Batter Runs Balls 4s 6s Strike Rate Brandon King 1 3 0 0 33.33 Shai Hope 0 3 0 0 0.00 Shimron Hetmyer 23 12 2 2 191.67 Roston Chase 34 29 6 0 117.24 Sherfane Rutherford 76* 42 2 7 180.95 Rovman Powell 14 13 2 0 107.69 Jason Holder 33 17 1 4 194.12 Romario Shepherd 1* 1 0 0 100.00 Akeal Hosein Did not bat — — — — Gudakesh Motie Did not bat — — — — Shamar Joseph Did not bat — — — — Extras 14 — — — — Total 196/6 20 overs RR: 9.80 Note: The asterisk () indicates a batter who remained not out.* Rutherford anchored the innings with an unbeaten 76, striking seven sixes. Holder provided late acceleration with 33 off just 17 balls, including four sixes. Their contributions helped West Indies add substantial runs in the closing overs. West Indies Batting Performance West Indies had a difficult beginning after Shai Hope and Brandon King were dismissed with only eight runs on the scoreboard. England’s opening bowlers took advantage of the early movement and attacking field placements. Hetmyer responded with a quick 23 from 12 balls, while Chase contributed 34 from 29 deliveries. Their efforts helped West Indies rebuild after the early setbacks. Rutherford became the central figure in the innings. His unbeaten knock combined controlled stroke play with powerful hitting, allowing him to remain at the crease until the end. Holder’s aggressive contribution added further momentum, particularly during the final four overs. Batting Highlight Performance Highest individual score Sherfane Rutherford – 76* Fastest major innings Shimron Hetmyer – 23 off 12 balls Most sixes Sherfane Rutherford – 7 Late-innings contribution Jason Holder – 33 off 17 balls Total boundaries by Rutherford 2 fours and 7 sixes Team total 196/6 The combination of Rutherford’s innings and Holder’s late acceleration proved central to West Indies reaching a total close to 200. England Bowling Scorecard England used a combination of pace and spin to try to contain the West Indies batters. Adil Rashid returned two wickets while Jamie Overton also claimed two. Rashid was particularly economical, conceding just 16 runs in four overs. Bowler Overs Maidens Runs Wickets Economy Jofra Archer 4 0 48 1 12.00 Sam Curran 3 0 36 1 12.00 Will Jacks 2 0 32 0 16.00 Jamie Overton 4 0 33 2 8.25 Adil Rashid 4 0 16 2 4.00 Liam Dawson 3 0 27 0 9.00 Rashid’s spell slowed West Indies during the middle overs and removed Chase and Powell. Overton also made important breakthroughs, dismissing Hetmyer and Holder. However, the runs scored by Rutherford and Holder offset these wickets and kept England under pressure. England Innings Scorecard England needed 197 runs to win. Phil Salt provided a fast start, while Jacob Bethell and Sam Curran made useful contributions. However, Gudakesh Motie’s three wickets and Roston Chase’s two dismissals disrupted England’s chase. Batter Runs Balls 4s 6s Strike Rate Phil Salt 30 14 4 2 214.29 Jos Buttler 21 14 2 1 150.00 Jacob Bethell 33 23 4 1 143.48 Tom Banton 2 4 0 0 50.00 Harry Brook 17 14 1 0 121.43 Sam Curran 43* 30 3 2 143.33 Will Jacks 2 3 0 0 66.67 Jamie Overton 5 6 0 0 83.33 Jofra Archer 6 4 1 0 150.00 Liam Dawson 1 1 0 0 100.00 Adil Rashid 0 1 0 0 0.00 Extras 6 — — — — Total 166 all out 19 overs RR: 8.74 England’s innings ended at 166, leaving the team 30 runs short of the target. Curran remained unbeaten on 43, but the fall of wickets at the other end made a successful chase increasingly difficult. England Batting Performance England started with intent, scoring quickly through Salt and Buttler. Salt’s 30 from 14 balls gave England early momentum, and Buttler added 21 before falling to Chase. Bethell continued the attack with 33 from 23 balls. However, England lost Tom Banton and Bethell in quick succession, allowing

Australian Men’s Cricket Team Vs South Africa National Cricket Team Match Scorecard

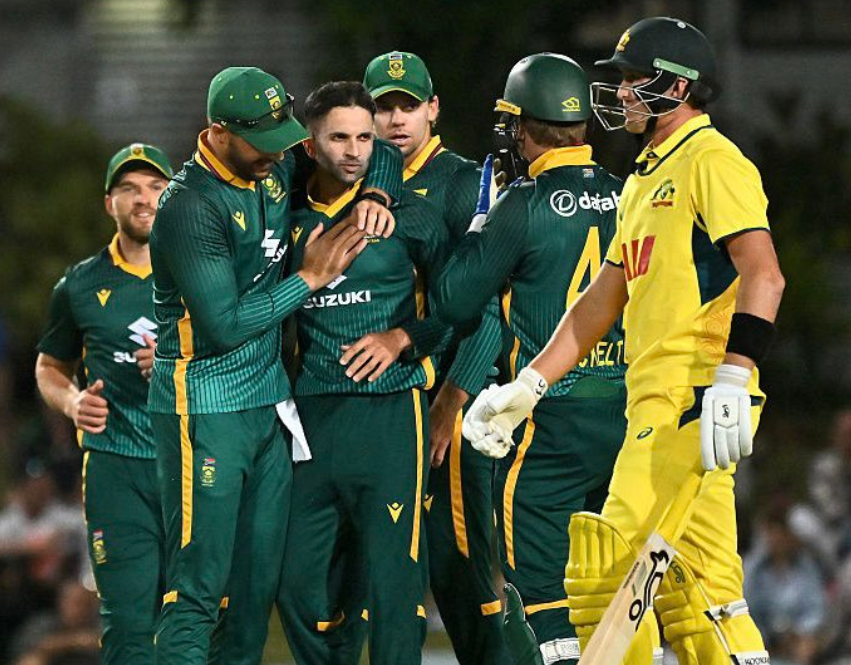
The Australian Men’s Cricket Team and South Africa National Cricket Team faced each other in the third and final ODI of Australia’s tour of South Africa on September 30, 2026, at Senwes Park in Potchefstroom. Australia won the rain-affected match by 45 runs under the Duckworth-Lewis-Stern method after scoring 322/9 in 50 overs and restricting South Africa to 145/4 in 28 overs. Alex Carey was Australia’s leading batter with 74 runs from 88 balls, while captain Mitchell Marsh scored a quick 56 from 42 deliveries. South Africa’s Ryan Rickelton remained unbeaten on 71, but rain stopped the chase after 28 overs, with South Africa below the revised DLS target. Carey was named Player of the Match, while Keshav Maharaj was named Player of the Series. This match scorecard provides a detailed look at both innings, batting and bowling performances, fall of wickets, important partnerships, key statistics and the final ODI series result. Australia vs South Africa Match Overview Match details: South Africa won the toss and elected to bowl first. Australia responded with 322/9 from their 50 overs. Rain interrupted South Africa’s chase and reduced the match to a 28-over second innings. South Africa reached 145/4, but the revised DLS target was beyond their score, giving Australia a 45-run victory. Match Detail Information Match South Africa vs Australia, 3rd ODI Series Australia tour of South Africa 2026 Date September 30, 2026 Venue Senwes Park, Potchefstroom Toss South Africa won and elected to bowl Australia Score 322/9 Australia Overs 50 overs South Africa Score 145/4 South Africa Overs 28 overs Result Australia won by 45 runs Method DLS Player of the Match Alex Carey Player of the Series Keshav Maharaj Match context: The third ODI was the final match of the three-match series. South Africa had already secured the series after winning the opening two matches, making the final game a chance for Australia to finish the tour with a victory. Australia First Innings Scorecard Australia’s batting innings: Australia produced a competitive 322/9 from 50 overs after being asked to bat first. Mitchell Marsh and Travis Head gave Australia a strong start, with the opening pair putting together 78 runs. Marsh scored 56 from 42 balls, including eight fours and two sixes. Head contributed 24 from 20 deliveries before Corbin Bosch dismissed him. Oliver Peake and Alex Carey then built an important partnership. Peake scored 48 from 53 balls, while Carey produced the innings’ highest score with 74 from 88 deliveries. Australia Batter R B 4s 6s SR Mitchell Marsh 56 42 8 2 133.33 Travis Head 24 20 5 0 120.00 Cooper Connolly 23 33 2 0 69.70 Oliver Peake 48 53 4 1 90.57 Alex Carey 74 88 4 2 84.09 Matt Renshaw 30 29 2 1 103.45 Cameron Green 23 18 1 1 127.78 Xavier Bartlett 2 4 0 0 50.00 Pat Cummins 11 6 2 0 183.33 Mitchell Starc 11* 7 1 1 157.14 Adam Zampa 0* 2 0 0 0.00 Extras 20 Total 322/9 50 overs 6.44 RR Australia Batting Performance Alex Carey’s important innings: Carey was Australia’s highest scorer with 74 from 88 balls. His innings included four fours and two sixes and provided stability during the middle overs. Mitchell Marsh’s attacking contribution: Marsh scored 56 from only 42 balls, giving Australia a fast start. His strike rate of 133.33 helped establish the platform for a total above 300. Oliver Peake’s useful 48: Peake narrowly missed a half-century but made an important contribution in the middle order. His partnership with Carey helped Australia move beyond the 190-run mark. Late-order acceleration: Matt Renshaw, Cameron Green, Pat Cummins and Mitchell Starc all added useful runs. Australia moved from 257/5 to 322/9, adding 65 runs during the final nine overs. South Africa Bowling Scorecard South Africa’s bowling performance: Corbin Bosch was South Africa’s most successful bowler, taking 4/60 from nine overs. Gerald Coetzee and Lizaad Williams claimed two wickets each. Bjorn Fortuin also took one wicket and was among South Africa’s more economical bowlers. South Africa Bowler O M R W Economy Gerald Coetzee 9 1 61 2 6.80 Lizaad Williams 6 0 48 2 8.00 Corbin Bosch 9 1 60 4 6.67 Bjorn Fortuin 9 0 50 1 5.56 Nqobani Mokoena 7 0 42 0 6.00 Aiden Markram 8 0 42 0 5.25 Tristan Stubbs 2 0 10 0 5.00 Corbin Bosch’s four wickets: Bosch finished with 4/60 and was responsible for dismissing Travis Head, Oliver Peake, Alex Carey and Cameron Green. His four wickets kept Australia from scoring even higher. Australia Fall of Wickets Australia’s wickets: Australia lost Head at 78, followed by Marsh at 94 and Connolly at 118. Peake and Carey then provided stability before Australia accelerated during the final stages. Wicket Batter Score Over 1 Travis Head 78 8.4 2 Mitchell Marsh 94 13.1 3 Cooper Connolly 118 17.1 4 Oliver Peake 191 31.1 5 Matt Renshaw 257 41.3 6 Alex Carey 285 45.5 7 Xavier Bartlett 288 46.4 8 Cameron Green 298 47.4 9 Pat Cummins 314 48.5 South Africa Second Innings Scorecard South Africa’s chase: South Africa were set a substantial target after Australia posted 322/9. The chase began badly when Quinton de Kock was dismissed for a duck in the second over. Aiden Markram followed soon afterward, leaving South Africa at 30/2. Ryan Rickelton and Matthew Breetzke then rebuilt the innings with a 72-run partnership. Tristan Stubbs later fell for 14, but Rickelton remained unbeaten on 71 when rain brought the match to an early end. South Africa Batter R B 4s 6s SR Aiden Markram 15 16 3 0 93.75 Quinton de Kock 0 5 0 0 0.00 Ryan Rickelton 71* 81 5 2 87.65 Matthew Breetzke 25 29 3 0 86.21 Tristan Stubbs 14 17 1 0 82.35 Corbin Bosch 13* 20 1 0 65.00 Extras 7 Total 145/4 28 overs 5.18 RR South Africa Batting Performance Ryan Rickelton’s unbeaten 71: Rickelton was South Africa’s leading batter and remained unbeaten when rain stopped play. He scored 71

Bangladesh National Cricket Team Vs New Zealand National Cricket Team Match Scorecard

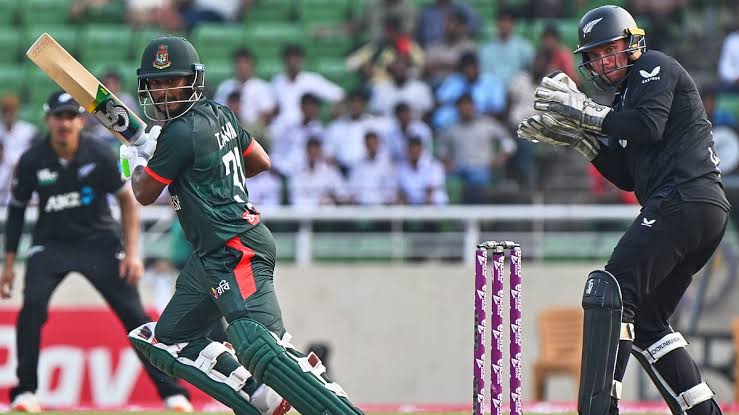
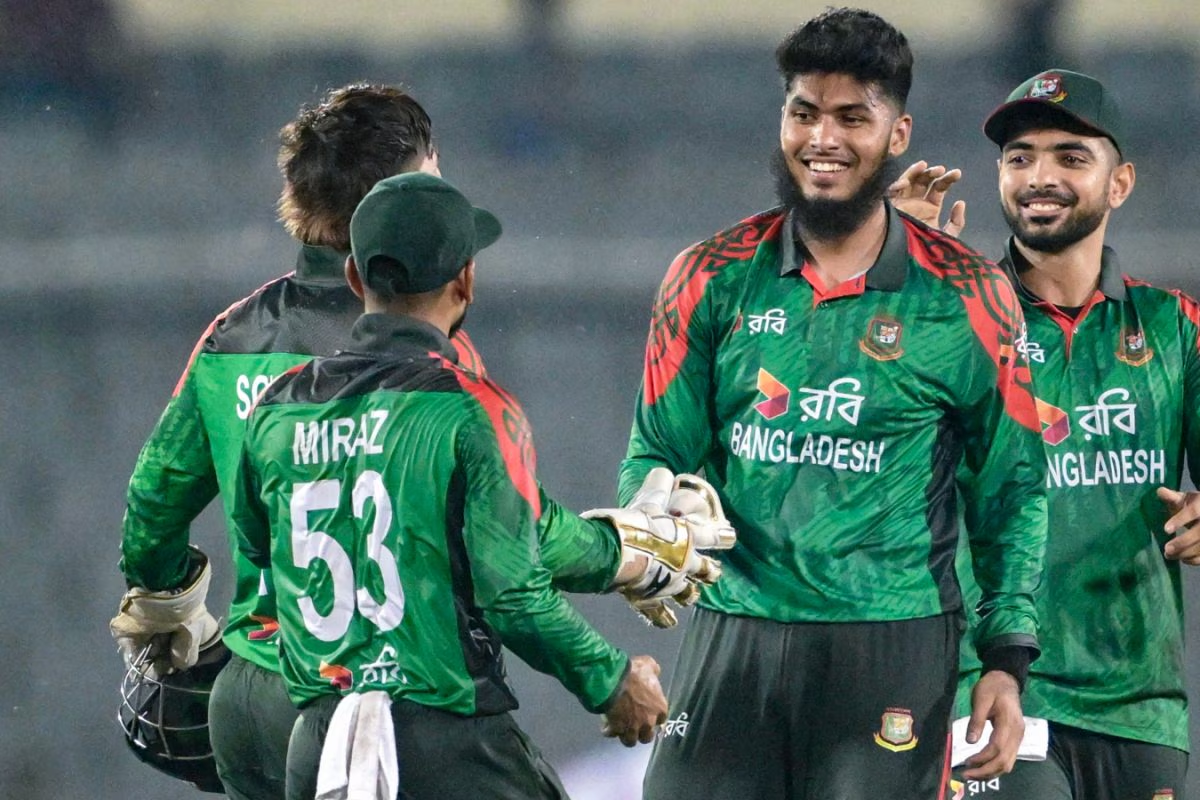
The Bangladesh National Cricket Team and New Zealand National Cricket Team faced each other in the third and final T20I of New Zealand’s tour of Bangladesh on May 2, 2026, at the Shere Bangla National Stadium in Mirpur, Dhaka. The match was reduced to 15 overs per side because of rain, and New Zealand chased a revised target of 103 to win by six wickets through the Duckworth-Lewis-Stern method. Bangladesh were bowled out for 102 in 14.2 overs after choosing to bat first. Towhid Hridoy was Bangladesh’s highest scorer with 33 runs from 24 balls, while Litton Das contributed 26 from 17 deliveries. New Zealand’s Josh Clarkson was the standout bowler, taking 3/9 from two overs. New Zealand’s chase was led by Bevon Jacobs, who smashed an unbeaten 62 from just 31 balls at a strike rate of 200. Dean Foxcroft remained unbeaten on 15 as New Zealand reached 104/4 in 11.4 overs. Jacobs was named Player of the Match. Bangladesh vs New Zealand Match Overview Match details: New Zealand won the toss and elected to field first. Bangladesh scored 102 all out in 14.2 overs after rain reduced the contest to 15 overs per side. New Zealand were set a revised target of 103 and reached 104/4 in 11.4 overs. Match Detail Information Match Bangladesh vs New Zealand, 3rd T20I Series New Zealand tour of Bangladesh 2026 Date May 2, 2026 Venue Shere Bangla National Stadium, Mirpur, Dhaka Toss New Zealand won and elected to field Bangladesh Score 102 all out Bangladesh Overs 14.2 overs New Zealand Score 104/4 New Zealand Overs 11.4 overs Revised Target 103 Result New Zealand won by 6 wickets Method DLS Player of the Match Bevon Jacobs Player of the Series Towhid Hridoy Match context: Rain played an important role in the deciding T20I. The original 20-over contest was reduced to 15 overs per side after a lengthy interruption. Bangladesh could not use all of their allotted overs because they were bowled out in 14.2 overs. Bangladesh First Innings Scorecard Bangladesh’s batting innings: Bangladesh struggled to build a substantial total after being asked to bat first. Saif Hassan made 16 from 11 balls, while Litton Das and Towhid Hridoy provided the major contributions in the middle order. Hridoy top-scored with 33 from 24 balls, including three fours and two sixes. Litton Das struck three fours and one six during his 26-ball innings from 17 deliveries. Bangladesh Batter R B 4s 6s SR Saif Hassan 16 11 2 0 145.45 Tanzid Hasan 6 10 0 0 60.00 Litton Das 26 17 3 1 152.94 Parvez Hossain Emon 0 1 0 0 0.00 Towhid Hridoy 33 24 3 2 137.50 Shamim Hossain 3 8 0 0 37.50 Mahedi Hasan 7* 6 1 0 116.67 Mohammad Saifuddin 0 1 0 0 0.00 Rishad Hossain 5 4 0 0 125.00 Shoriful Islam 2 3 0 0 66.67 Ripon Mondol 0 1 0 0 0.00 Extras 4 Total 102 14.2 overs 7.12 RR Bangladesh Batting Performance Towhid Hridoy’s innings: Hridoy was the leading Bangladesh run-scorer, making 33 from 24 balls. His two sixes and three fours helped Bangladesh cross the 100-run mark after the team lost wickets at regular intervals. Litton Das’s contribution: Litton Das scored 26 from 17 balls and briefly increased the scoring rate after Bangladesh had lost early wickets. His dismissal at 63/4 was an important moment in the innings. Late-order struggle: Bangladesh lost their final six wickets for only 39 runs. Mahedi Hasan remained unbeaten on seven, but the lower order could not provide enough runs to push the total towards a more competitive score. New Zealand Bowling Scorecard New Zealand’s bowling performance: Josh Clarkson produced the best bowling figures of the match, taking 3/9 from two overs. Nathan Smith and Ben Sears claimed two wickets each, while Jayden Lennox and Ish Sodhi took one apiece. New Zealand Bowler O M R W Economy Dean Foxcroft 2 0 17 0 8.50 Nathan Smith 2 0 14 2 7.00 Ben Sears 2.2 0 12 2 5.14 Jayden Lennox 3 0 28 1 9.33 Ish Sodhi 3 0 22 1 7.33 Josh Clarkson 2 0 9 3 4.50 Josh Clarkson’s spell: Clarkson conceded only nine runs and took three wickets, including the dismissals of Litton Das, Towhid Hridoy and Mohammad Saifuddin. His spell restricted Bangladesh during the crucial middle stages. Ben Sears at the finish: Sears removed Shoriful Islam and Ripon Mondol in the 15th over, completing Bangladesh’s innings at 102. Bangladesh Fall of Wickets Bangladesh’s wickets: Bangladesh lost Saif Hassan at 21, Tanzid Hasan at 35 and Parvez Hossain Emon immediately afterward. The innings then moved to 63/4 before the middle and lower order struggled to add runs. Wicket Batter Score Over 1 Saif Hassan 21 3.1 2 Tanzid Hasan 35 4.3 3 Parvez Hossain Emon 35 4.4 4 Litton Das 63 8.2 5 Shamim Hossain 86 11.3 6 Towhid Hridoy 88 12.1 7 Mohammad Saifuddin 89 12.2 8 Rishad Hossain 95 13.1 9 Shoriful Islam 102 14.1 10 Ripon Mondol 102 14.2 New Zealand Second Innings Scorecard New Zealand’s chase: New Zealand’s chase started with a brief period of uncertainty. Katene Clarke and Dane Cleaver were dismissed quickly, while Tim Robinson fell at 25/3. Nick Kelly then departed with the score at 33/4, leaving New Zealand in a difficult position. Bevon Jacobs responded with an outstanding attacking innings, taking control of the chase alongside Dean Foxcroft. New Zealand Batter R B 4s 6s SR Tim Robinson 23 14 2 1 164.29 Katene Clarke 1 2 0 0 50.00 Dane Cleaver 1 3 0 0 33.33 Nick Kelly 1 5 0 0 20.00 Bevon Jacobs 62* 31 5 3 200.00 Dean Foxcroft 15* 15 1 0 100.00 Extras 1 Total 104/4 11.4 overs 8.91 RR New Zealand Batting Performance Bevon Jacobs’ match-winning innings: Jacobs produced the defining performance of the match, scoring 62 not out from only 31 balls. He struck five fours and three sixes and finished with a strike rate of exactly 200.

West Indies Cricket Team Vs Bangladesh National Cricket Team Match Scorecard

The West Indies Cricket Team and Bangladesh National Cricket Team met in the third and final T20I of the West Indies tour of Bangladesh 2025-26 on October 31, 2025, at the Bir Shrestha Shaheed Flight Lieutenant Motiur Rahman Cricket Stadium in Chattogram. West Indies won the match by five wickets with 19 balls remaining after chasing Bangladesh’s total of 151 in just 16.5 overs. Bangladesh’s innings was built around a superb 89 from Tanzid Hasan, but the team suffered a dramatic collapse late in the innings. Bangladesh went from 107/2 in the 15th over to 151 all out. Romario Shepherd played a major role in the collapse, taking a hat-trick and finishing with 3/36. West Indies then produced an aggressive chase. Roston Chase and Ackeem Auguste both scored half-centuries, combining for a 91-run fourth-wicket partnership. Chase made 50 from 29 balls, while Auguste smashed 50 from only 25 deliveries. Chase was named Player of the Match. West Indies vs Bangladesh Match Overview Match details: The third T20I was played in Chattogram on October 31, 2025. Bangladesh won the toss and batted first, scoring 151 all out in 20 overs. West Indies successfully chased the target, reaching 152/5 in 16.5 overs to win by five wickets with 19 balls remaining. Match Detail Information Match Bangladesh vs West Indies, 3rd T20I Series West Indies tour of Bangladesh 2025-26 Date October 31, 2025 Venue Bir Shrestha Shaheed Flight Lieutenant Motiur Rahman Cricket Stadium, Chattogram Bangladesh Score 151 all out West Indies Score 152/5 Bangladesh Overs 20 West Indies Overs 16.5 Result West Indies won by 5 wickets Balls Remaining 19 Player of the Match Roston Chase Series Result West Indies won 3-0 Match context: The third T20I completed a clean sweep for West Indies. They had already won the first T20I by 16 runs and the second T20I by 14 runs before producing another successful chase in the final match. Bangladesh First Innings Scorecard Bangladesh’s batting innings: Bangladesh started reasonably well and reached 107/2 in the 15th over. Tanzid Hasan played the innings of the match for Bangladesh, scoring 89 from 62 balls. His innings contained nine fours and four sixes and came at a strike rate of 143.54. Tanzid’s innings kept Bangladesh on course for a substantial total, but the middle and lower order could not maintain the momentum. After reaching 107/2, Bangladesh lost eight wickets for just 44 runs. Bangladesh Batter R B 4s 6s SR Tanzid Hasan 89 62 9 4 143.55 Parvez Hossain Emon 9 10 0 1 90.00 Litton Das 6 9 1 0 66.67 Saif Hassan 23 22 0 2 104.55 Rishad Hossain 3 3 0 0 100.00 Nurul Hasan 1 3 0 0 33.33 Nasum Ahmed 1 3 0 0 33.33 Jaker Ali Anik 5 3 1 0 166.67 Mahedi Hasan 0* 0 0 0 — Shoriful Islam 0 1 0 0 0.00 Taskin Ahmed 9 4 0 1 225.00 Extras 5 Total 151 20 overs 7.55 RR Bangladesh Batting Performance Tanzid Hasan’s outstanding innings: Tanzid Hasan was comfortably Bangladesh’s leading scorer. His 89 from 62 balls accounted for a large portion of Bangladesh’s total and included 13 boundaries in total. He remained at the crease until the final over before being dismissed for 89. Saif Hassan’s contribution: Saif Hassan scored 23 from 22 balls and helped Bangladesh maintain a competitive scoring rate during the middle overs. Late collapse: The major problem for Bangladesh came after the team reached 107/2. Eight wickets fell for only 44 additional runs, preventing Bangladesh from finishing with a much larger total. West Indies Bowling Scorecard West Indies bowling performance: Romario Shepherd was the standout bowler with 3/36 from four overs. Jason Holder also took two wickets, while Akeal Hosein, Roston Chase and Khary Pierre claimed one wicket each. West Indies Bowler O M R W Economy Jason Holder 4 0 32 2 8.00 Akeal Hosein 4 0 26 1 6.50 Romario Shepherd 4 0 36 3 9.00 Roston Chase 4 0 23 1 5.75 Khary Pierre 3 0 23 2 7.67 Gudakesh Motie 1 0 11 0 11.00 Romario Shepherd’s hat-trick: Shepherd dismissed Nurul Hasan, Nasum Ahmed and Shoriful Islam across two overs to complete a hat-trick. His spell played a major part in Bangladesh losing its last eight wickets for only 44 runs. Bangladesh Fall of Wickets Bangladesh’s wickets: Bangladesh lost Parvez Hossain Emon at 22, followed by Litton Das at 44. The team was still in a strong position at 107/2, but Saif Hassan’s dismissal at 107 triggered a late collapse. Wicket Batter Score Over 1 Parvez Hossain Emon 22 3.1 2 Litton Das 44 7.3 3 Saif Hassan 107 14.4 4 Rishad Hossain 118 15.6 5 Nurul Hasan 126 16.6 6 Nasum Ahmed 133 17.6 7 Jaker Ali Anik 142 18.6 8 Tanzid Hasan 142 19.1 9 Shoriful Islam 142 19.2 10 Taskin Ahmed 151 19.6 West Indies Second Innings Scorecard West Indies’ chase: West Indies lost Alick Athanaze early and were 37/2 before Brandon King was dismissed for eight. At that stage, Bangladesh had an opportunity to apply pressure. Roston Chase and Ackeem Auguste completely changed the match. They added 91 runs for the fourth wicket and took West Indies from a difficult position to within touching distance of victory. West Indies Batter R B 4s 6s SR Alick Athanaze 1 8 0 0 12.50 Amir Jangoo 34 23 5 1 147.83 Brandon King 8 7 2 0 114.29 Roston Chase 50 29 5 1 172.41 Ackeem Auguste 50 25 1 5 200.00 Rovman Powell 5* 5 0 0 100.00 Gudakesh Motie 3* 4 0 0 75.00 Extras 1 Total 152/5 16.5 overs 9.03 RR West Indies Batting Performance Roston Chase’s half-century: Chase scored 50 from 29 balls, hitting five fours and one six. His strike rate of 172.41 reflected the aggressive nature of the chase. His innings also earned him the Player of the Match award. Ackeem Auguste’s attacking fifty: Auguste was even more aggressive, scoring 50 from only 25 balls. His innings included

India National Cricket Team Vs Zimbabwe National Cricket Team Match Scorecard

The India National Cricket Team and Zimbabwe National Cricket Team faced each other in the third and final T20I of India’s 2026 tour of Zimbabwe on July 26, 2026, at Harare Sports Club in Harare. India won the match by 35 runs after scoring 192/5 in 20 overs and restricting Zimbabwe to 157/7 in their 20 overs. The victory completed a 3-0 series sweep for India. Vaibhav Sooryavanshi was the standout performer, scoring 81 runs from 49 balls and receiving both the Player of the Match and Player of the Series awards. Rinku Singh provided a late boost with 25 from 14 balls, while Shreyas Iyer and Ishan Kishan also made valuable contributions. For Zimbabwe, Ryan Burl top-scored with an unbeaten 54 from 43 balls, but the hosts could only reach 157/7. The scorecard below provides a complete overview of the batting performances, bowling figures, fall of wickets, partnerships, key statistics and major moments from the match. Match details: The third T20I was played at Harare Sports Club on July 26, 2026. India won the toss and elected to bat first. India finished with 192/5, setting Zimbabwe a target of 193. Zimbabwe reached 157/7 in 20 overs, giving India a 35-run victory. Match Detail Information Match India vs Zimbabwe, 3rd T20I Series India tour of Zimbabwe 2026 Date July 26, 2026 Venue Harare Sports Club, Harare Toss India won and elected to bat India Score 192/5 in 20 overs Zimbabwe Score 157/7 in 20 overs Target 193 Result India won by 35 runs Player of the Match Vaibhav Sooryavanshi Player of the Series Vaibhav Sooryavanshi Series Result India won 3-0 Match context: India entered the final T20I with the series already in their favour after winning the first two matches. The first T20I was won by seven wickets, while the second T20I ended with a 90-run Indian victory. India therefore completed a clean sweep with the 35-run win in the third match. India First Innings Scorecard India’s batting innings: India chose to bat first and posted 192/5 from their allotted 20 overs. Vaibhav Sooryavanshi anchored the innings with an aggressive 81 from 49 balls. He struck eight fours and four sixes at a strike rate above 165. Abhishek Sharma fell early for two, but Sooryavanshi and Ishan Kishan rebuilt the innings. Kishan scored 29 from 26 balls, while Shreyas Iyer added 27 from 18 deliveries. Rinku Singh provided the late acceleration, scoring 25 from only 14 balls. Tilak Varma remained unbeaten on 11 from nine balls as India reached 192/5. India Batter R B 4s 6s SR Vaibhav Sooryavanshi 81 49 8 4 165.31 Abhishek Sharma 2 4 0 0 50.00 Ishan Kishan 29 26 4 0 111.54 Shreyas Iyer 27 18 2 0 150.00 Tilak Varma 11* 9 1 0 122.22 Rinku Singh 25 14 2 1 178.57 Extras 17 Total 192/5 20 overs 9.60 RR India’s innings pattern: India scored 64/1 during the mandatory powerplay and reached 100/2 in 10.5 overs. Sooryavanshi’s partnership with Kishan gave India a strong middle-overs platform before Iyer and Rinku accelerated the scoring rate. India Batting Performance Vaibhav Sooryavanshi’s innings: The teenager produced the highest score of the match, hitting 81 from 49 deliveries. His innings contained eight fours and four sixes and came at a strike rate of 165.31. He reached his second T20I half-century during the series and was dismissed at 145/3 in the 15th over. Middle-order contribution: Ishan Kishan’s 29 and Shreyas Iyer’s 27 gave India stability after Abhishek Sharma’s early dismissal. Iyer scored at a strike rate of 150, helping maintain India’s scoring momentum. Late acceleration: Rinku Singh struck 25 from 14 balls at a strike rate of 178.57. His innings helped India add valuable runs during the final overs and finish on 192/5. Zimbabwe Bowling Scorecard Zimbabwe’s bowling effort: Zimbabwe used seven bowlers during India’s innings. Brad Evans claimed two wickets, while Sikandar Raza, Blessing Muzarabani and Wessly Madhevere took one wicket each. Zimbabwe Bowler O M R W Economy Sikandar Raza 4 0 40 1 10.00 Blessing Muzarabani 4 0 33 1 8.25 Newman Nyamhuri 2 0 18 0 9.00 Brad Evans 4 0 41 2 10.25 Wellington Masakadza 1 0 14 0 14.00 Wessly Madhevere 4 0 37 1 9.25 Brian Bennett 1 0 7 0 7.00 Bowling highlights: Brad Evans was Zimbabwe’s leading wicket-taker with 2/41. Blessing Muzarabani removed Abhishek Sharma early, while Sikandar Raza broke the 75-run partnership between Sooryavanshi and Kishan. India Fall of Wickets India’s wickets: India lost five wickets during the innings. Abhishek Sharma was the first to fall at 20, followed by Ishan Kishan at 95. Sooryavanshi was dismissed for 81 at 145, while Shreyas Iyer and Rinku Singh fell during the final stages. Wicket Batter Score Over 1 Abhishek Sharma 20 1.5 2 Ishan Kishan 95 10.1 3 Vaibhav Sooryavanshi 145 15.0 4 Shreyas Iyer 164 17.1 5 Rinku Singh 192 20.0 Zimbabwe Second Innings Scorecard Zimbabwe’s chase: Zimbabwe needed 193 runs to win but lost Brian Bennett from the very first ball. The hosts then slipped to 34/3 after Dion Myers and Sikandar Raza were dismissed in the fourth over. Ryan Burl provided resistance with an unbeaten 54 from 43 balls. Wessly Madhevere contributed 28 from 25 balls, but Zimbabwe’s early wickets left them too far behind the required rate. Zimbabwe finished on 157/7 after 20 overs, 35 runs short of India’s total. Zimbabwe Batter R B 4s 6s SR Brian Bennett 0 1 0 0 0.00 Ben Curran 20 19 2 0 105.26 Dion Myers 19 15 1 1 126.67 Sikandar Raza 0 1 0 0 0.00 Ryan Burl 54* 43 5 0 125.58 Wessly Madhevere 28 25 1 2 112.00 Tadiwanashe Marumani 1 3 0 0 33.33 Brad Evans 14 13 0 1 107.69 Newman Nyamhuri 1* 1 0 0 100.00 Extras 20 Total 157/7 20 overs 7.85 RR Zimbabwe Batting Performance Ryan Burl’s half-century: Burl was Zimbabwe’s top scorer, finishing unbeaten on 54 from 43 balls. His innings included five fours and came at

Afghanistan National Cricket Team Vs South Africa National Cricket Team Match Scorecard

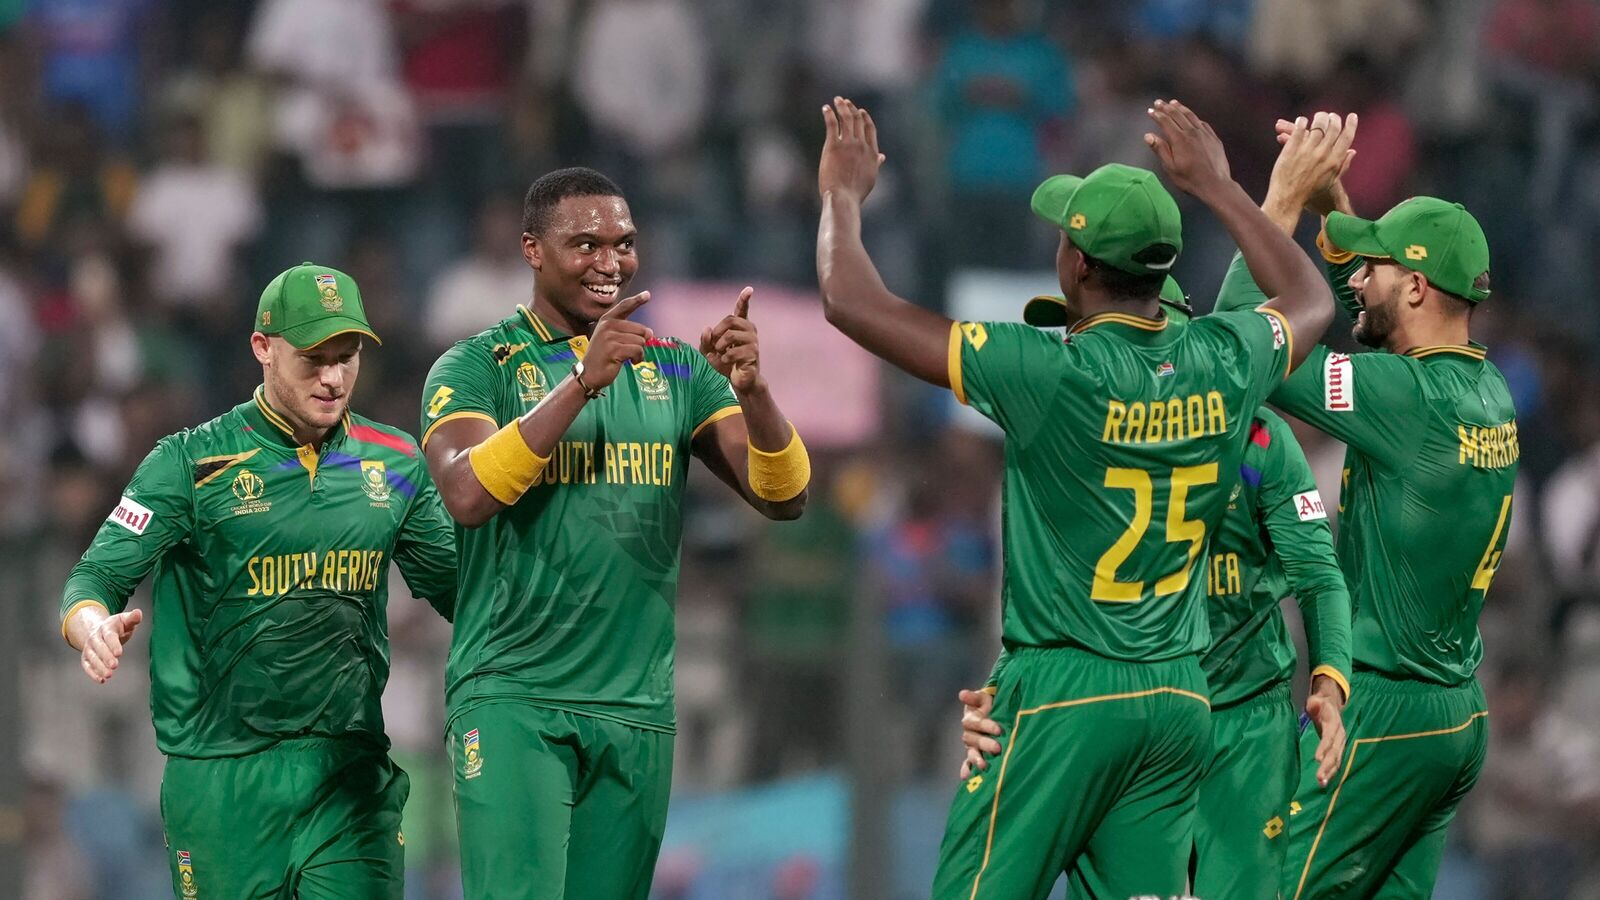
The Afghanistan National Cricket Team vs South Africa National Cricket Team match scorecard from the ICC Men’s T20 World Cup 2026 records one of the most dramatic T20 internationals between the two teams. Played at the Narendra Modi Stadium in Ahmedabad on 11 February 2026, the match finished level after both teams scored 187 in their allotted innings. South Africa eventually won after two Super Overs, making it the first match in T20 World Cup history to require a second Super Over. South Africa scored 187/6 in 20 overs, with Ryan Rickelton making 61 and Quinton de Kock scoring 59. Afghanistan responded with exactly 187 all out in 19.4 overs, led by a spectacular 84 from Rahmanullah Gurbaz. The regulation match was followed by a first Super Over, which also ended level at 17 runs apiece. South Africa then scored 23 in the second Super Over and restricted Afghanistan to 19/2, winning the extraordinary contest by four runs. Lungi Ngidi was named Player of the Match after taking three wickets for 26 runs in the main innings. Afghanistan vs South Africa Match Scorecard at a Glance Match Detail Information Match Afghanistan vs South Africa Tournament ICC Men’s T20 World Cup 2026 Stage Group D Date 11 February 2026 Venue Narendra Modi Stadium, Ahmedabad Format T20 International Toss Afghanistan won the toss and fielded South Africa Score 187/6 in 20 overs Afghanistan Score 187 all out in 19.4 overs Regulation Result Match tied First Super Over South Africa 17/1, Afghanistan 17/0 Second Super Over South Africa 23/0, Afghanistan 19/2 Final Result South Africa won by 4 runs Player of the Match Lungi Ngidi South Africa Top Scorer Ryan Rickelton – 61 Afghanistan Top Scorer Rahmanullah Gurbaz – 84 Best South Africa Bowler Lungi Ngidi – 3/26 Best Afghanistan Bowler Azmatullah Omarzai – 3/41 South Africa Innings Scorecard Afghanistan won the toss and chose to bowl first. South Africa lost captain Aiden Markram early, but Quinton de Kock and Ryan Rickelton quickly changed the momentum. De Kock scored 59 from 41 balls, hitting five fours and three sixes. Rickelton was even more aggressive, scoring 61 from only 28 balls, including five fours and four sixes. The pair added 116 runs from 61 balls, giving South Africa a strong platform. Afghanistan captain Rashid Khan eventually dismissed both batters in quick succession. Dewald Brevis contributed 23, while Marco Jansen produced a rapid 16 from seven balls. David Miller remained unbeaten on 20, allowing South Africa to finish on 187/6. South Africa Batting Scorecard Batter R B 4s 6s Strike Rate Aiden Markram 5 8 1 0 62.50 Quinton de Kock 59 41 5 3 143.90 Ryan Rickelton 61 28 5 4 217.86 Dewald Brevis 23 19 1 1 121.05 David Miller 20* 15 1 1 133.33 Tristan Stubbs 1 2 0 0 50.00 Marco Jansen 16 7 2 1 228.57 Extras 3 Total 187/6 20 overs Afghanistan Bowling Scorecard Bowler Overs Runs Wickets Economy Fazalhaq Farooqi 4 32 1 8.00 Mujeeb Ur Rahman 3 30 0 10.00 Azmatullah Omarzai 4 41 3 10.25 Mohammad Nabi 2 20 0 10.00 Rashid Khan 4 28 2 7.00 Noor Ahmad 3 35 0 11.67 Azmatullah Omarzai was Afghanistan’s leading wicket-taker with 3/41, while Rashid Khan claimed two important wickets by dismissing de Kock and Rickelton. Fall of Wickets – South Africa Score Wicket Over 12 Aiden Markram 2.3 126 Quinton de Kock 12.4 127 Ryan Rickelton 12.6 155 Dewald Brevis 17.2 159 Tristan Stubbs 17.6 187 Marco Jansen 19.6 South Africa’s biggest partnership came between de Kock and Rickelton. Their 116-run stand placed South Africa in a strong position before Afghanistan fought back during the final overs. Afghanistan Innings Scorecard Afghanistan needed 188 to win and began the chase at an extraordinary pace. Rahmanullah Gurbaz was the central figure in Afghanistan’s innings. He smashed 84 from 42 balls, hitting four fours and seven sixes. His strike rate of exactly 200 kept Afghanistan ahead of the required rate during the middle overs. Ibrahim Zadran scored 12, but Afghanistan suddenly lost three wickets in quick succession. Gulbadin Naib fell for a duck, followed by Sediqullah Atal for a duck. Gurbaz continued attacking and Afghanistan reached 121/4 before he was dismissed by Keshav Maharaj. Azmatullah Omarzai then scored 22 from 17 balls, while Rashid Khan contributed 20 from 12 deliveries. Noor Ahmad remained unbeaten on 15 from nine balls. Afghanistan were eventually bowled out for 187 in 19.4 overs, creating a tie and forcing the first Super Over. Afghanistan Batting Scorecard Batter R B 4s 6s Strike Rate Rahmanullah Gurbaz 84 42 4 7 200.00 Ibrahim Zadran 12 10 1 1 120.00 Gulbadin Naib 0 2 0 0 0.00 Sediqullah Atal 0 3 0 0 0.00 Darwish Rasooli 15 18 0 0 83.33 Azmatullah Omarzai 22 17 3 0 129.41 Mohammad Nabi 5 6 0 0 83.33 Rashid Khan 20 12 3 0 166.67 Mujeeb Ur Rahman 0 1 0 0 0.00 Noor Ahmad 15* 9 0 2 166.67 Fazalhaq Farooqi 0 0 0 0 — Extras 14 Total 187 all out 19.4 overs South Africa Bowling Scorecard Bowler Overs Runs Wickets Economy Lungi Ngidi 4 26 3 6.50 Marco Jansen 4 42 1 10.50 Kagiso Rabada 3.4 38 1 10.36 George Linde 3 39 1 13.00 Keshav Maharaj 4 27 1 6.75 Aiden Markram 1 14 0 14.00 Lungi Ngidi’s 3/26 was the best bowling performance for South Africa. He played a crucial role in preventing Afghanistan from finishing the chase before the final over. Fall of Wickets – Afghanistan Score Wicket Over 51 Ibrahim Zadran 4.2 51 Gulbadin Naib 4.4 52 Sediqullah Atal 5.2 121 Rahmanullah Gurbaz 12.3 121 Darwish Rasooli 12.5 139 Mohammad Nabi 15.1 164 Azmatullah Omarzai 17.5 169 Rashid Khan 18.3 175 Mujeeb Ur Rahman 18.6 187 Fazalhaq Farooqi 19.4 Afghanistan’s final wickets fell rapidly, but Noor Ahmad’s late sixes helped take the team level with South Africa. The First Super Over With both teams finishing on 187, the match went into a Super

SportsShave.com brings you the latest sports news, match updates, player insights, team coverage, scores, and trending stories from the world of sports. Stay informed and connected with everything happening in sports.

© 2026 Created with SportsShave.com